1. 목차
- 개발환경
- 개발완성보고서
- 요구사항분석서
- 개발 일정표
- DB구조도
- 프로그램 구조도
- 프로젝트 발표 PPT 자료
- 소스 코드
- 프로그램 시연
- 첨부 파일
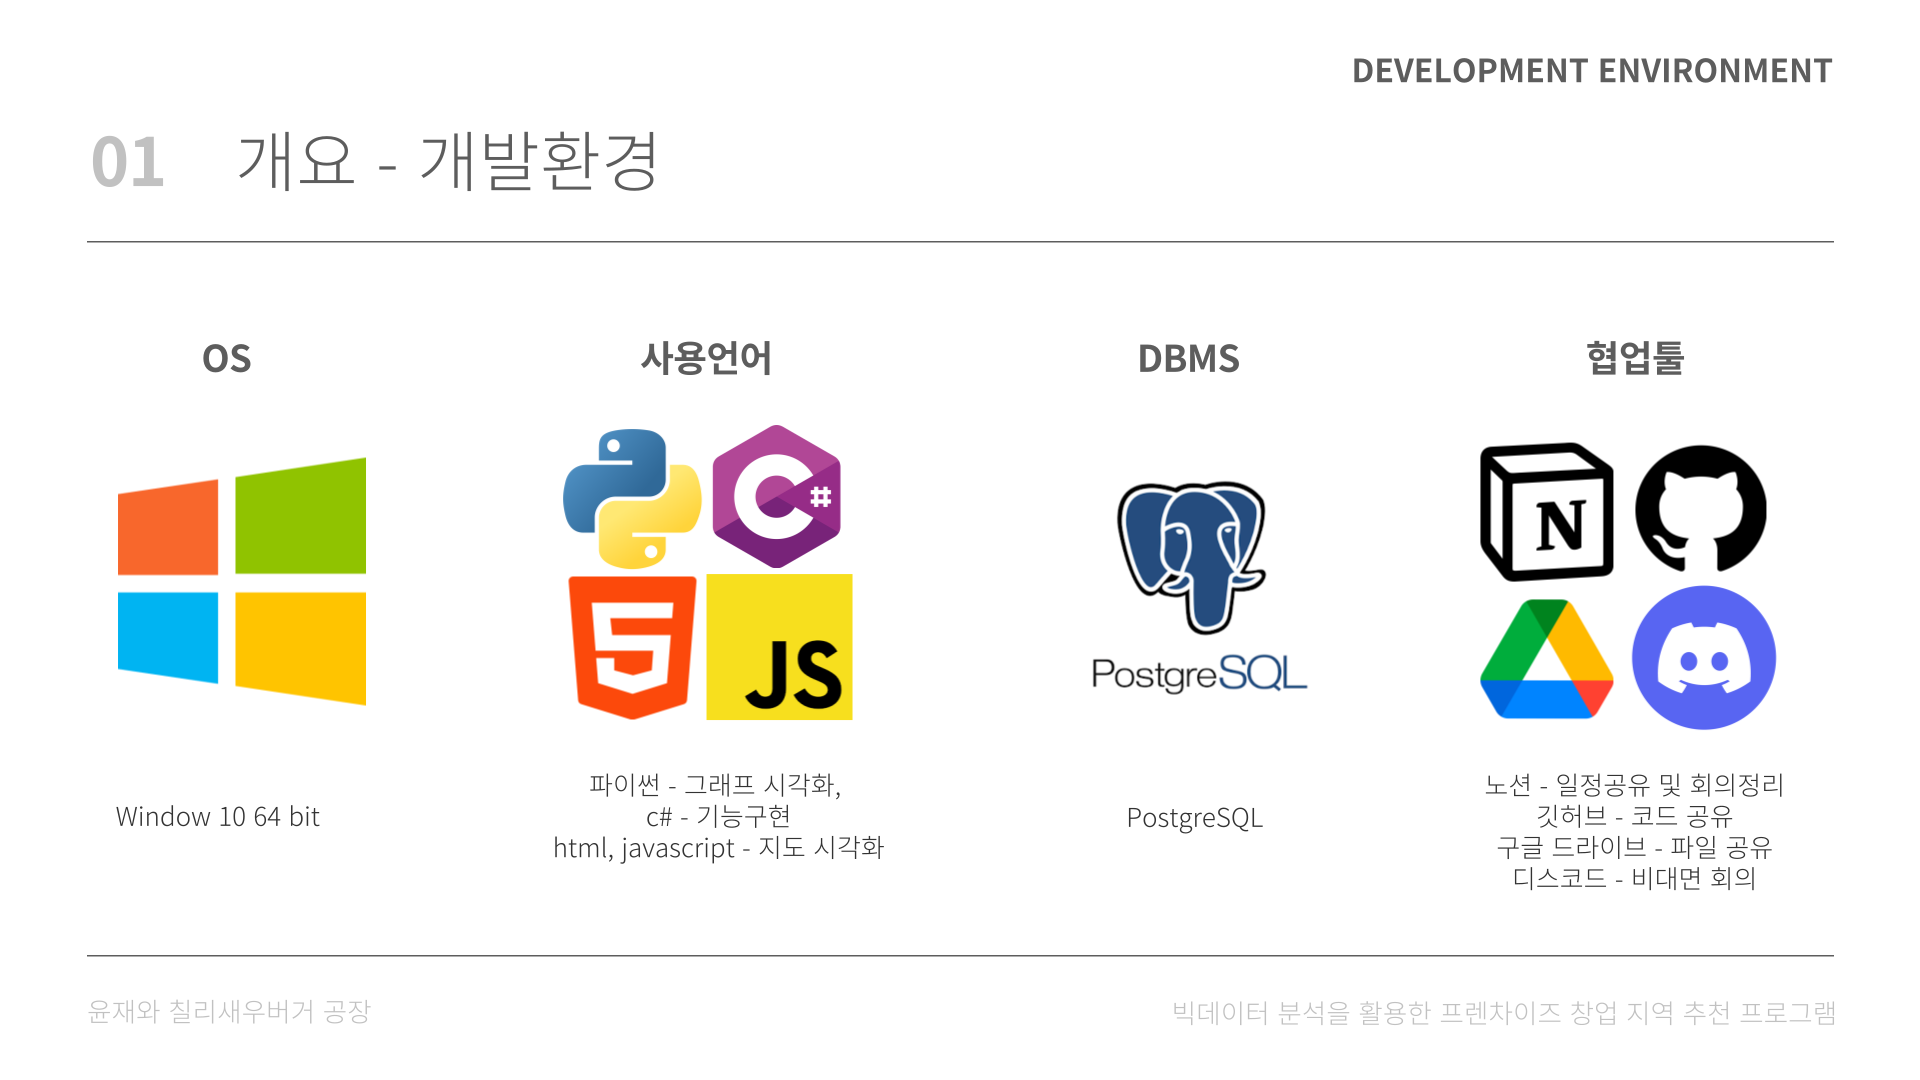
2. 개발환경
- 운영체제: Window 10 64 bit
- 개발언어: Python 3.11, C#, JavaScript
- 개발 툴: Pycharm, Visual Studio 2022
- DBSM: PostgreSQL
- 추가 패키지: Pandas, Matplotlib, Npgsql, Newtonsoft.Json, JavaScirptEngineSwicher.Core
3. 개발완성보고서


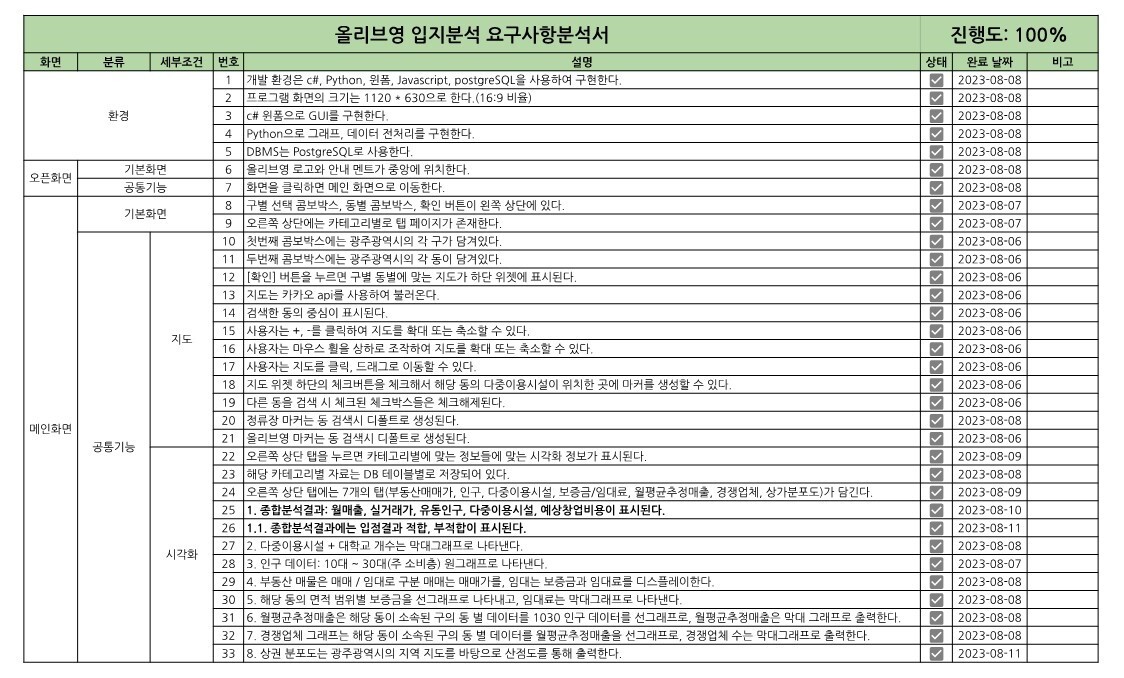
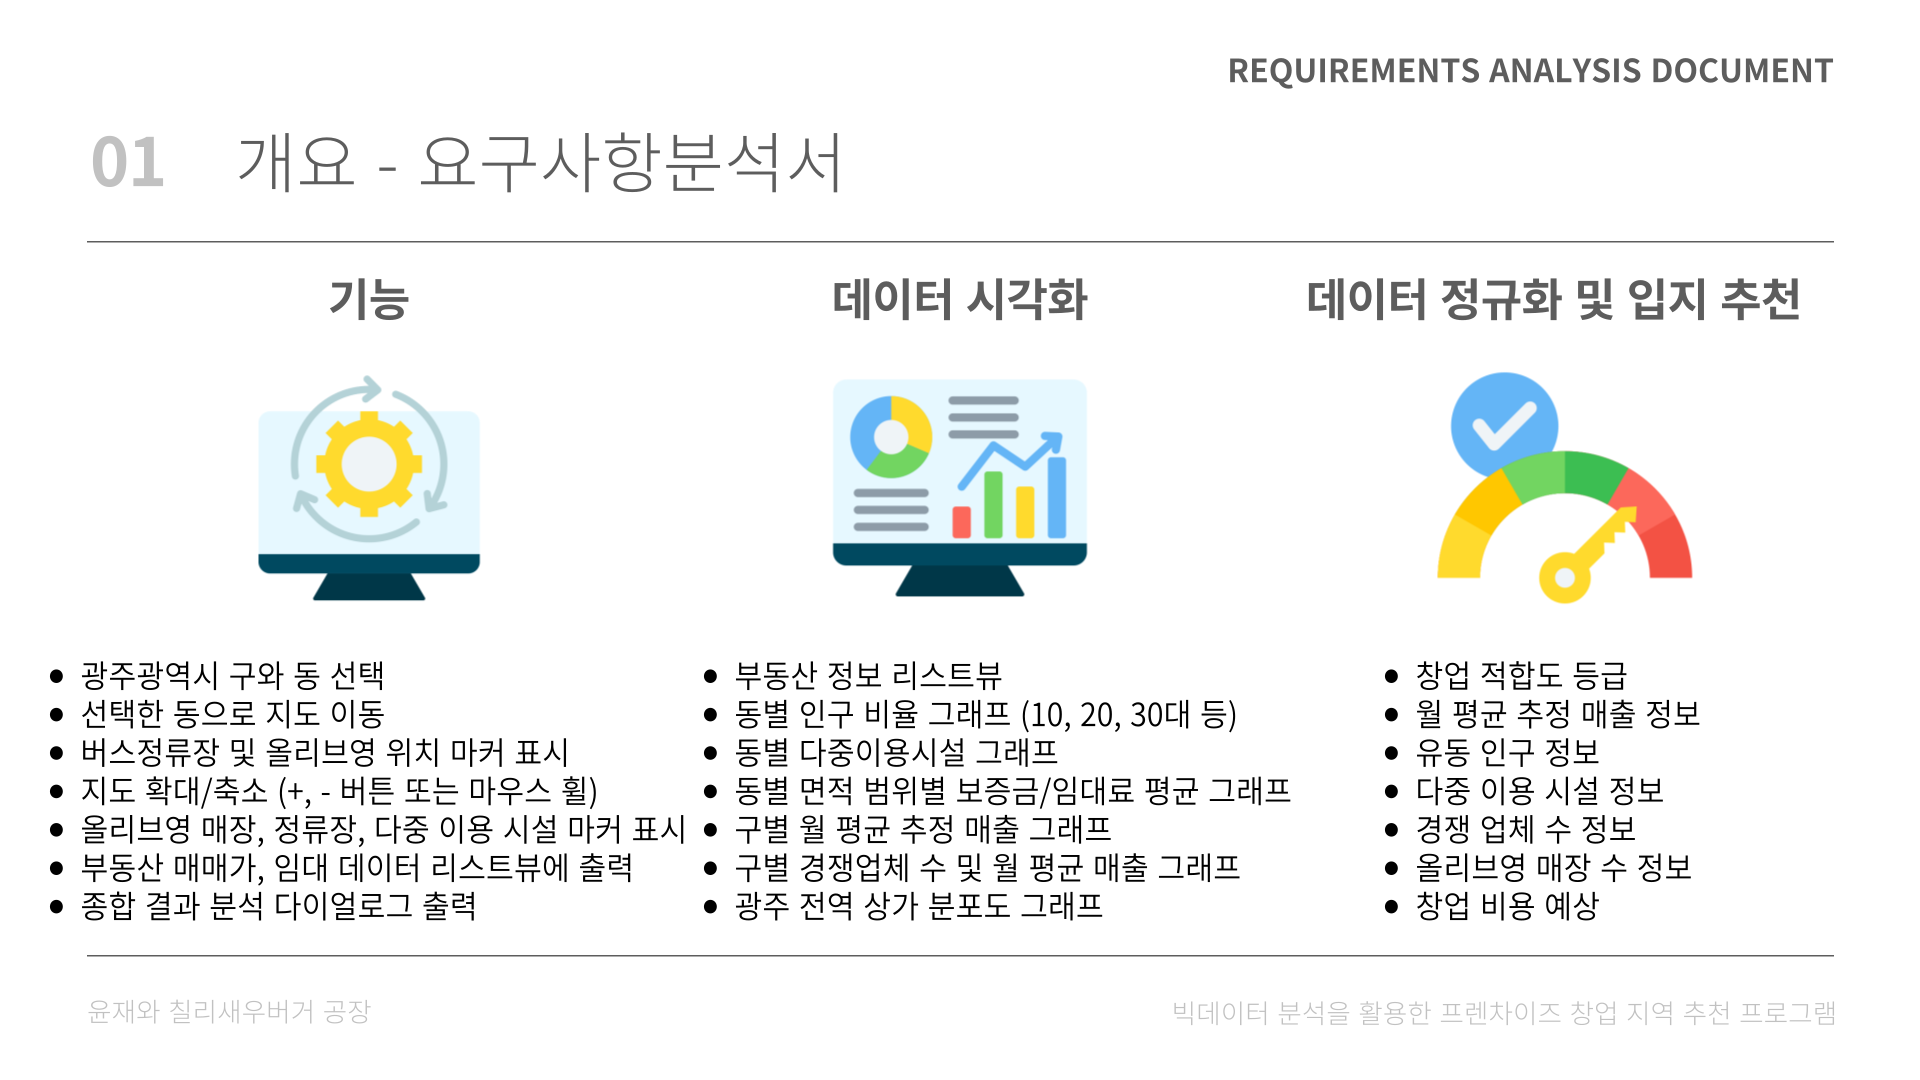
3.1. 요구사항분석서

3.2. 개발 일정표


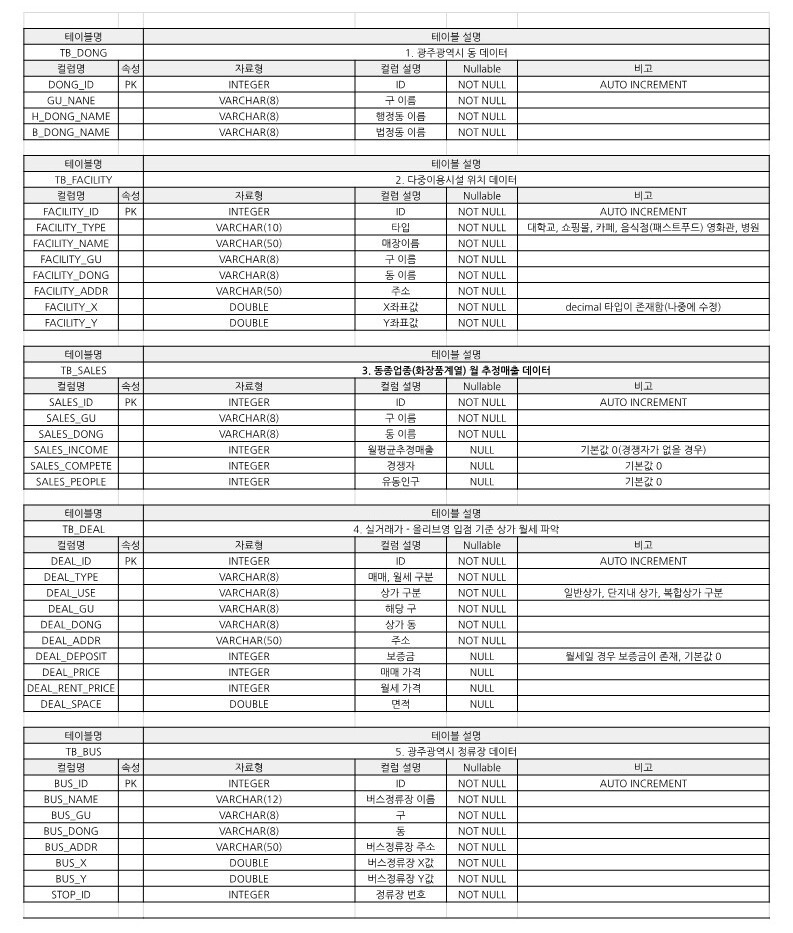
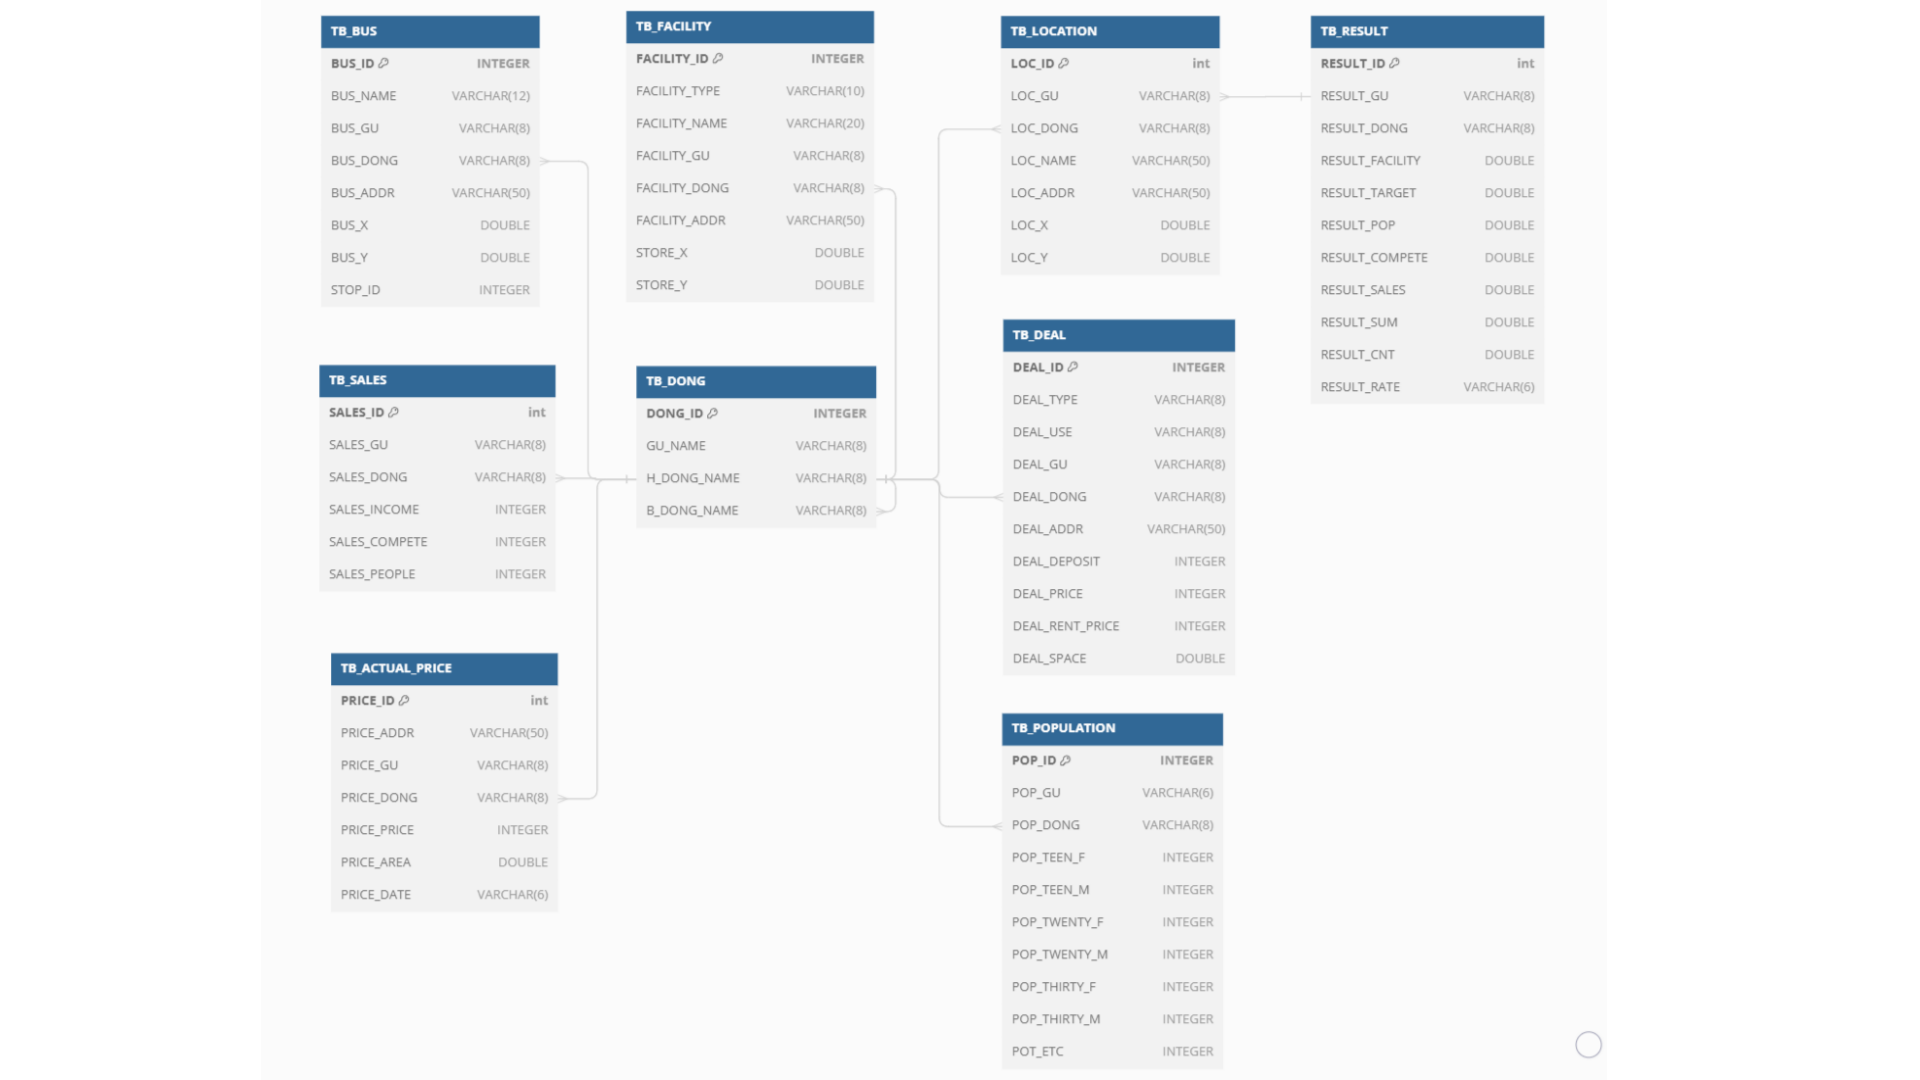
3.3. 데이터베이스 구조도

3.4. ERD

3.5. 프로그램 작동 순서도

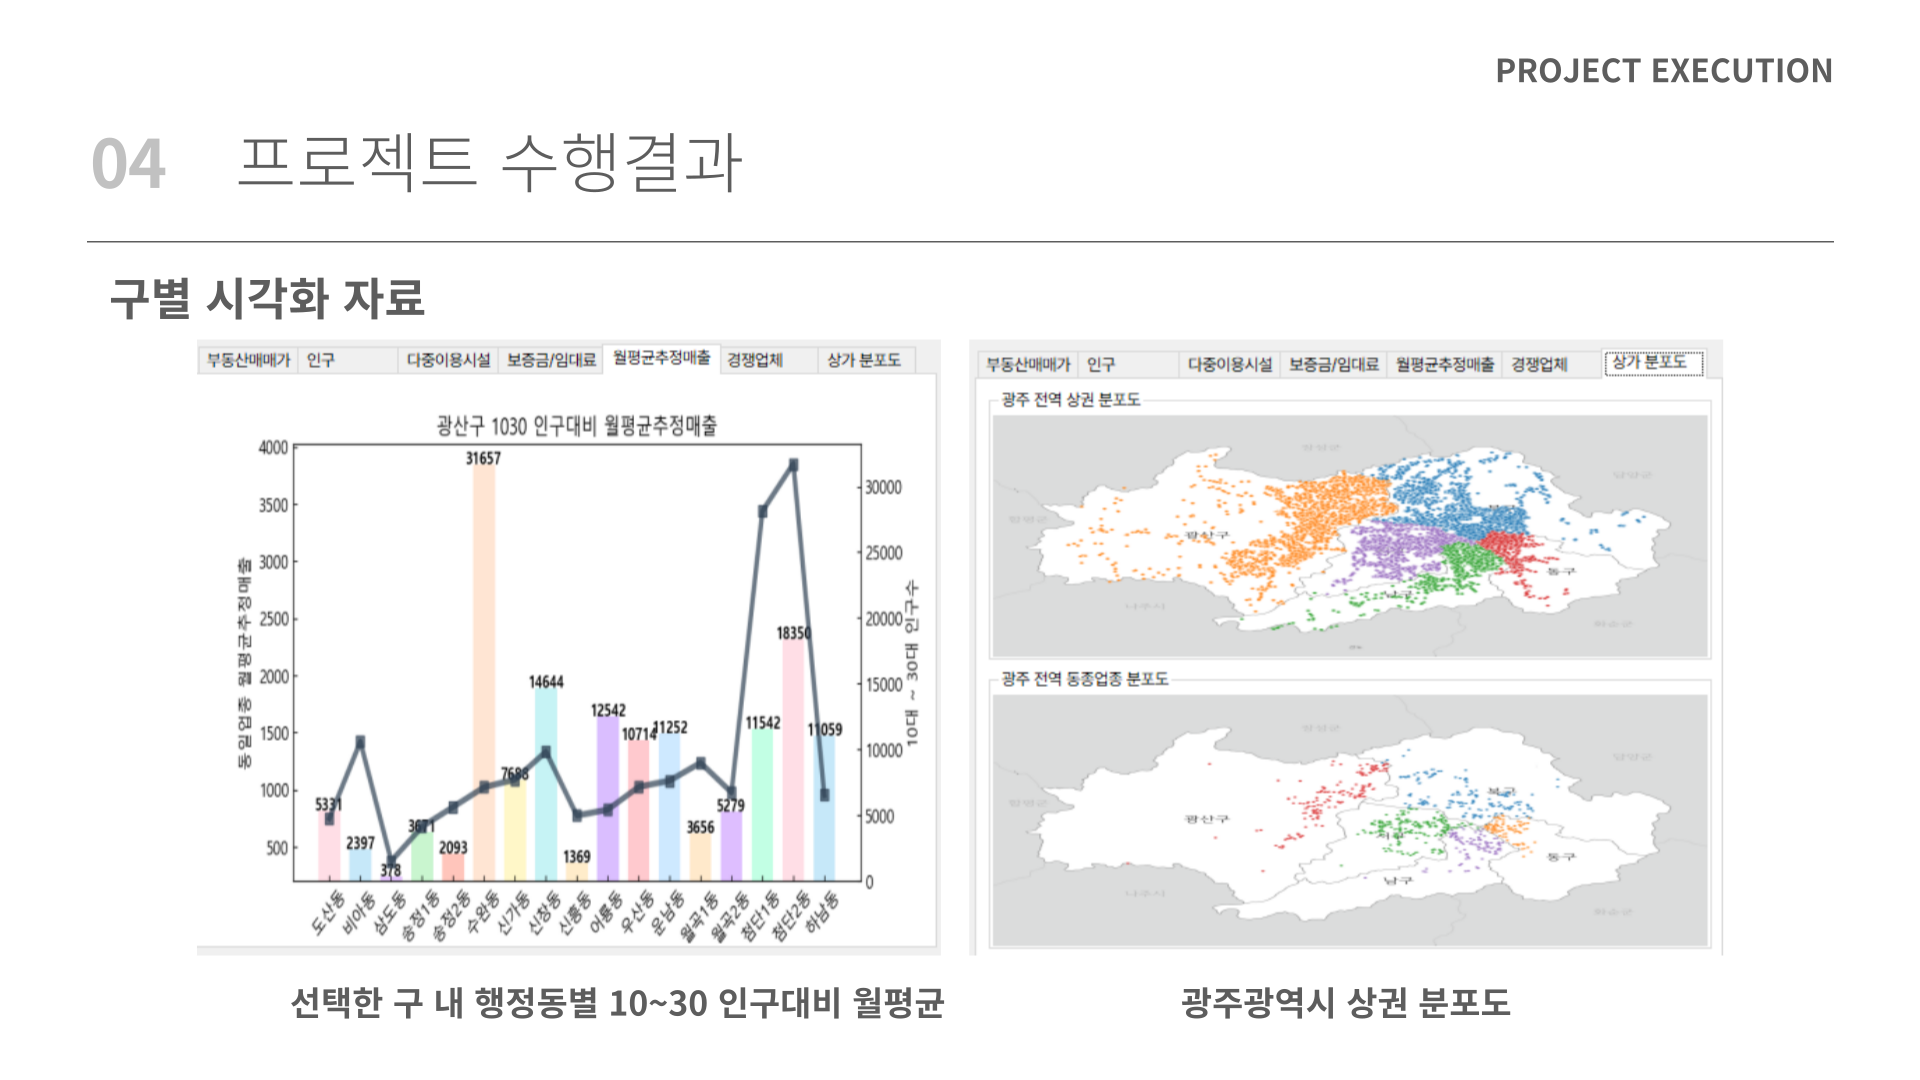
4. 프로젝트 발표 PPT 자료


5. 소스 코드
StartForm.cs
      <csharp />


      using System;
using System.Windows.Forms;

namespace FranchiseProject
{
    public partial class StartForm : Form
    {
        public StartForm()
        {
            InitializeComponent();
        }

        private void ScreenTransition(object sender, MouseEventArgs e)
        {
            MainForm MainForm = new MainForm();
            MainForm.Show();
            this.Hide();
        }

        private void pictureboxClicked(object sender, EventArgs e)
        {
            MainForm MainForm = new MainForm();
            MainForm.Show();
            this.Hide();
        }
    }
MainForm.cs
더보기
<csharp />
//using static System.Windows.Forms.VisualStyles.VisualStyleElement;
//using Newtonsoft.Json;
//using System.Diagnostics;
using Npgsql;
using System;
using System.Collections.Generic;
using System.Drawing;
using System.Drawing.Text;
using System.IO;
using System.Linq;
using System.Net;
using System.Text;
using System.Web.Script.Serialization;
using System.Windows.Forms;
namespace FranchiseProject
{
public partial class MainForm : Form
{
// 지역명, 위도, 경도 (ex. "문정동", "37.412412", "124.512512")
List<Tuple<string, double, double>> tuples = new List<Tuple<string, double, double>>();
// DB 불러오기
private const string ConnectionString = "Host=10.10.20.103;Username=postgres;Password=1234;Database=franchise";
// 검색 버튼 클릭 됐는지 감지
bool clickDetected = false;
// 마우스 드래그를 위한 offset 변수
private Point offset;
// 전역 변수
private string minCostValue_;
private string maxCostValue_;
private string salesIncome_;
private string salesPeople_;
private string facilityCnt_;
private string resultRate_;
private string resultCnt_;
private string resultCompete_;
// 생성자
public MainForm()
{
InitializeComponent();
InitializeComboBoxes();
}
// 지도
private void MainForm_Load(object sender, EventArgs e)
{
SetFontList();
// 로드될 때 생성
// WebBrowser 컨트롤에 "kakaoMap.html" 을 표시한다.
Version ver = webBrowser1.Version;
string name = webBrowser1.ProductName;
string str = webBrowser1.ProductVersion;
string html = "kakaoMap.html";
string dir = Directory.GetCurrentDirectory();
string path = Path.Combine(dir, html);
webBrowser1.Navigate(path);
SetFontList();
}
// 메인폼 테두리 설정
private void MainForm_Paint(object sender, PaintEventArgs e)
{
ControlPaint.DrawBorder(e.Graphics, this.ClientRectangle,
Color.Black, 2, ButtonBorderStyle.Solid,
Color.Black, 2, ButtonBorderStyle.Solid,
Color.Black, 2, ButtonBorderStyle.Solid,
Color.Black, 2, ButtonBorderStyle.Solid);
}
// 폰트 불러오는 함수
public static Font FontLoad(int fontNum, int fontSize)
{
string[] fontPaths = { @"font\Pretendard-Regular.ttf", @"font\Maplestory_Bold.ttf" };
string baseDirectory = Directory.GetParent(Environment.CurrentDirectory).Parent.FullName;
using (PrivateFontCollection privateFonts = new PrivateFontCollection())
{
foreach (string fontPath in fontPaths)
{
string fontFilePath = Path.Combine(baseDirectory, fontPath);
privateFonts.AddFontFile(fontFilePath);
}
if (fontNum >= 0 && fontNum < privateFonts.Families.Length)
{
return new Font(privateFonts.Families[fontNum], fontSize);
}
else
{
return SystemFonts.DefaultFont;
}
}
}
public void SetFont(Control control, int fontNum, int fontSize)
{
control.Font = FontLoad(fontNum, fontSize);
}
// DB
// 특정 테이블에서 특정 칼럼의 값을 반환하는 함수
public static List<string> GetValuesFromTable(string tableName, string columnName, string criteria = null, bool distinct = false)
{
List<string> results = new List<string>();
using (var connection = new NpgsqlConnection(ConnectionString))
{
connection.Open();
string distinctClause = distinct ? "DISTINCT" : ""; // distinct 값에 따라 쿼리 조각 결정
string query = $"SELECT {distinctClause} \"{columnName}\" FROM \"{tableName}\"";
if (!string.IsNullOrWhiteSpace(criteria))
{
query += $" WHERE {criteria}";
}
using (var cmd = new NpgsqlCommand(query, connection))
{
using (var reader = cmd.ExecuteReader())
{
while (reader.Read())
{
results.Add(reader.GetString(0));
}
}
}
}
return results;
}
// 특정 테이블의 여러 컬럼 값을 반환할
public static List<Dictionary<string, object>> GetValuesFromMultipleColumns(string tableName, List<string> columnNames, string criteria = null, bool distinct = false)
{
List<Dictionary<string, object>> results = new List<Dictionary<string, object>>();
using (var connection = new NpgsqlConnection(ConnectionString))
{
connection.Open();
string columns = string.Join(", ", columnNames.Select(c => $"\"{c}\""));
string distinctClause = distinct ? "DISTINCT" : ""; // distinct 값에 따라 쿼리 조각 결정
string query = $"SELECT {distinctClause} {columns} FROM \"{tableName}\"";
if (!string.IsNullOrWhiteSpace(criteria))
{
query += $" WHERE {criteria}";
}
Console.WriteLine(query);
using (var cmd = new NpgsqlCommand(query, connection))
{
using (var reader = cmd.ExecuteReader())
{
while (reader.Read())
{
var row = new Dictionary<string, object>();
for (int i = 0; i < reader.FieldCount; i++)
{
row[reader.GetName(i)] = reader.GetValue(i);
}
results.Add(row);
}
}
}
}
return results;
}
// 특정 테이블의 모든 행의 값을 반환하는 함수
public static List<Dictionary<string, object>> GetAllRowsFromTable(string tableName, string criteria = null)
{
List<Dictionary<string, object>> results = new List<Dictionary<string, object>>();
using (var connection = new NpgsqlConnection(ConnectionString))
{
connection.Open();
string query = $"SELECT * FROM \"{tableName}\"";
if (!string.IsNullOrWhiteSpace(criteria))
{
query += $" WHERE {criteria}";
}
using (var cmd = new NpgsqlCommand(query, connection))
{
using (var reader = cmd.ExecuteReader())
{
while (reader.Read())
{
var row = new Dictionary<string, object>();
for (int i = 0; i < reader.FieldCount; i++)
{
row[reader.GetName(i)] = reader.GetValue(i);
}
results.Add(row);
}
}
}
}
return results;
}
// 콤보박스
private void InitializeComboBoxes()
{
//콤보박스
string[] data = { "북구", "서구", "동구", "남구", "광산구" };
flatComboBox1.Items.Add("선택");
flatComboBox1.Items.AddRange(data); // 콤보박스에 자료 넣기
flatComboBox1.SelectedIndex = 0; // 첫번째 아이템 선택
}
//private void comboBox1_SelectedIndexChanged_1(object sender, EventArgs e)
//{
// // 첫 번째 콤보박스의 선택에 따라 두 번째 콤보박스의 항목을 설정
// string selectedGu = comboBox1.SelectedItem.ToString();
// update_combobox2(selectedGu);
// comboBox2.SelectedIndex = 0;
//}
private void flatComboBox1_SelectedIndexChanged(object sender, EventArgs e)
{
// 첫 번째 콤보박스의 선택에 따라 두 번째 콤보박스의 항목을 설정
string selectedGu = flatComboBox1.SelectedItem.ToString();
UpdateComboBox2(selectedGu);
flatComboBox2.SelectedIndex = 0;
}
private void UpdateComboBox2(string guName)
{
// 두 번째 콤보박스의 항목을 초기화
flatComboBox2.Items.Clear();
List<string> DongNames = GetValuesFromTable("TB_DONG", "H_DONG_NAME", $"\"GU_NAME\" = '{guName}' ORDER BY \"H_DONG_NAME\"", true);
flatComboBox2.Items.Add("선택");
foreach (string dong in DongNames)
{
flatComboBox2.Items.Add(dong); // ComboBox에 d를 추가합니다.
}
}
private void UpdateTabPage(string guName, string dongName)
{
// 현재 comboBox2에서 선택된 동(Dong) 이름을 가져옴
string dong = flatComboBox2.Text;
// DB로부터 가져올 칼럼 이름들을 리스트로 정의
var columns = new List<string> { "DEAL_TYPE", "DEAL_USE", "DEAL_GU", "DEAL_DONG", "DEAL_ADDR", "DEAL_DEPOSIT", "DEAL_PRICE", "DEAL_RENT_PRICE", "DEAL_SPACE" };
// DB로부터 지정된 조건의 레코드들을 가져옴
var data = GetValuesFromMultipleColumns("TB_DEAL", columns, $"\"DEAL_DONG\" = '{dongName}'");
// 기존 리스트 뷰 아이템을 모두 지움
listView1.Items.Clear();
listView2.Items.Clear();
// 가져온 각 행(레코드)에 대해 아래의 작업을 수행
foreach (var row in data)
{
// 해당 행에서 필요한 데이터를 가져옴
string dealType = row["DEAL_TYPE"].ToString();
string dealUse = row["DEAL_USE"].ToString();
string dealDeposit = row["DEAL_DEPOSIT"].ToString();
string dealPrice = row["DEAL_PRICE"].ToString();
string dealRentprice = row["DEAL_RENT_PRICE"].ToString();
string dealSpace = row["DEAL_SPACE"].ToString();
// 거래 유형이 '매매'인 경우
if (dealType == "매매")
{
// listView1에 해당 아이템을 추가
var item = new ListViewItem(dealType);
item.SubItems.Add($"{dealUse}");
item.SubItems.Add($"{dealPrice}");
item.SubItems.Add($"{dealSpace}");
listView1.Items.Add(item);
}
// 거래 유형이 '월세'인 경우
else if (dealType == "월세")
{
// listView2에 해당 아이템을 추가
var item = new ListViewItem(dealType);
item.SubItems.Add($"{dealUse}");
item.SubItems.Add($"{dealDeposit}");
item.SubItems.Add($"{dealRentprice}");
item.SubItems.Add($"{dealSpace}");
listView2.Items.Add(item);
}
// 출력 확인용: 현재 행의 모든 열(칼럼) 데이터를 콘솔에 출력
foreach (var keyValuePair in row)
{
Console.WriteLine($"{keyValuePair.Key}: {keyValuePair.Value}");
}
}
}
private void UpdatePictureBox(string guName, string dongName)
{
// 필요한 열 이름들을 리스트에 저장
var columns = new List<string> { "GU_NAME", "H_DONG_NAME" };
// GetValuesFromMultipleColumns 메서드를 사용하여 데이터베이스에서 해당 조건에 맞는 데이터를 가져옴
var data = GetValuesFromMultipleColumns("TB_DONG", columns, $" \"GU_NAME\" = '{guName}' and \"H_DONG_NAME\" = '{dongName}' ");
// 가져온 데이터가 없으면 함수를 종료
if (data.Count == 0)
{
return;
}
// 첫 번째 행의 데이터를 가져옴
var row = data[0];
string dongName_ = row["H_DONG_NAME"].ToString();
string guName_ = row["GU_NAME"].ToString();
// 이미지 파일들이 저장된 폴더 경로들을 배열에 저장
string[] folderNames = {
@"graph\00_동별_다중이용시설",
@"graph\01_동별_인구비율",
@"graph\02_동별_면적범위별_평균보증금_임대료_pastel",
@"graph\03_구별_1030인구대비_월평균추정매출",
@"graph\04_구별_월평균추정매출_경쟁업체",
@"graph\05_전역_광주광역시_화장품상가_분포도"
};
string currentDirectory = Directory.GetParent(Environment.CurrentDirectory).Parent.FullName;
// 각 폴더에서 해당 구와 동 이름을 포함하는 이미지 파일들의 경로를 가져옴
for (int idx = 0; idx < folderNames.Length; idx++)
{
string folderPath = Path.Combine(currentDirectory, folderNames[idx]);
List<string> imageFiles = GetMatchingImageFiles(folderPath, guName, dongName);
// 이미지 파일이 없는 경우 none_data 이미지로 설정
if (imageFiles.Count == 0)
{
string noneDataImagePath = Path.Combine(folderPath, "none_data.png");
Image noneDataImage = Image.FromFile(noneDataImagePath);
// 현재 폴더 인덱스에 따라 해당 PictureBox에 none_data를 설정
if (idx == 0)
{
facPictureBox.Image = noneDataImage;
}
else if (idx == 1)
{
popPictureBox.Image = noneDataImage;
}
else if (idx == 2)
{
pricePictureBox.Image = noneDataImage;
}
else if (idx == 3)
{
guPictureBox1.Image = noneDataImage;
}
else if (idx == 4)
{
guPictureBox2.Image = noneDataImage;
}
}
else
{
// 이미지 파일이 있는 경우, 해당 이미지를 설정
string imagePath = imageFiles[0];
Image image = Image.FromFile(imagePath);
// 현재 폴더 인덱스에 따라 해당 PictureBox에 이미지를 설정
if (idx == 0)
{
facPictureBox.Image = image;
}
else if (idx == 1)
{
popPictureBox.Image = image;
}
else if (idx == 2)
{
pricePictureBox.Image = image;
}
else if (idx == 3)
{
guPictureBox1.Image = image;
}
else if (idx == 4)
{
guPictureBox2.Image = image;
}
}
// 광주광역시 전체 데이터는 직접 경로와 파일명을 가져와서 pictureBox에 저장
rivalPictureBox1.Image = Image.FromFile(GetImagePath(folderNames[5], $"광주광역시_전체상가_지도.png"));
rivalPictureBox2.Image = Image.FromFile(GetImagePath(folderNames[5], $"광주광역시_화장품상가_지도.png"));
}
}
// 주어진 폴더 경로와 파일 이름을 기반으로 이미지 파일의 전체 경로를 생성하는 함수
private string GetImagePath(string folderPath, string fileName)
{
// 상대 경로를 가져옴
string currentDirectory = Directory.GetParent(Environment.CurrentDirectory).Parent.FullName;
// Path.Combine 메서드를 사용하여 현재 디렉토리, 폴더 경로, 파일 이름을 결합하여 이미지 파일의 전체 경로를 반환함
return Path.Combine(currentDirectory, folderPath, fileName);
}
// 주어진 기본 폴더 경로(baseFolderPath), 구이름(guName), 동이름(dongName)에 맞는 이미지 파일들을 찾아서 리스트로 반환
private List<string> GetMatchingImageFiles(string baseFolderPath, string guName, string dongName)
{
// 결과로 반환할 이미지 파일들을 담을 리스트 생성
List<string> imageFiles = new List<string>();
// 지정된 폴더 경로에서 특정 패턴에 맞는 파일들을 찾아옴 ('구이름_동이름.*' 형태)
string[] filesWithDong = Directory.GetFiles(baseFolderPath, $"{guName}_{dongName}.*");
string[] filesWithoutDong = Directory.GetFiles(baseFolderPath, $"{guName}.*");
// '구이름_동이름.*' 형태의 파일이 없을 경우 '구이름.*' 형태의 파일들을 가져옴
if (filesWithDong.Length == 0)
{
imageFiles.AddRange(filesWithoutDong);
}
else
{
// '구이름_동이름.*' 형태의 파일이 있을 경우 해당 파일들을 반환할 리스트에 추가
imageFiles.AddRange(filesWithDong);
}
// 결과 리스트 반환
return imageFiles;
}
// 지역 검색
public void Search(string area)
{
// 요청을 보낼 url
string site = "https://dapi.kakao.com/v2/local/search/address.json";
string query = string.Format("{0}?query={1}", site, area);
WebRequest request = WebRequest.Create(query); // 요청 생성.
string apiKey = "106e805bafc9548f37b878db306c0484"; // API 인증키 입력. (각자 발급한 API 인증키를 입력하자)
string header = "KakaoAK " + apiKey;
request.Headers.Add("Authorization", header); // HTTP 헤더 "Authorization" 에 header 값 설정.
WebResponse response = request.GetResponse(); // 요청을 보내고 응답 객체를 받는다.
Stream stream = response.GetResponseStream(); // 응답객체의 결과물
StreamReader reader = new StreamReader(stream, Encoding.UTF8);
String json = reader.ReadToEnd(); // JOSN 포멧 문자열
//Console.WriteLine("결과물" + json);
JavaScriptSerializer js = new JavaScriptSerializer(); // (Reference 에 System.Web.Extensions.dll 을 추가해야한다)
var dob = js.Deserialize<dynamic>(json);
var docs = dob["documents"];
object[] buf = docs;
int length = buf.Length;
for (int i = 0; i < length; i++) // 지역명, 위도, 경도 읽어오기.
{
string addressName = docs[i]["address_name"];
double x = double.Parse(docs[i]["x"]); // 위도
double y = double.Parse(docs[i]["y"]); // 경도
tuples.Add(new Tuple<string, double, double>(addressName, x, y));
Console.WriteLine("저장한주소값: " + addressName + x + y);
}
}
// 지도 확대
private void ZoomInMap(object sender, EventArgs e)
{
webBrowser1.Document.InvokeScript("zoomIn"); // 줌인
}
// 지도 축소
private void ZoomOutMap(object sender, EventArgs e)
{
webBrowser1.Document.InvokeScript("zoomOut"); // 줌아웃
}
// 검색 버튼 눌렀을 때 연결
private void SearchButtonClick(object sender, EventArgs e)
{
tabControl1.SelectedIndex = 0;
SetFontList();
//정보 불러오기
tuples.Clear();
string gu = flatComboBox1.Text;
string dong = flatComboBox2.Text;
string newAddr = "광주광역시 " + gu + dong;
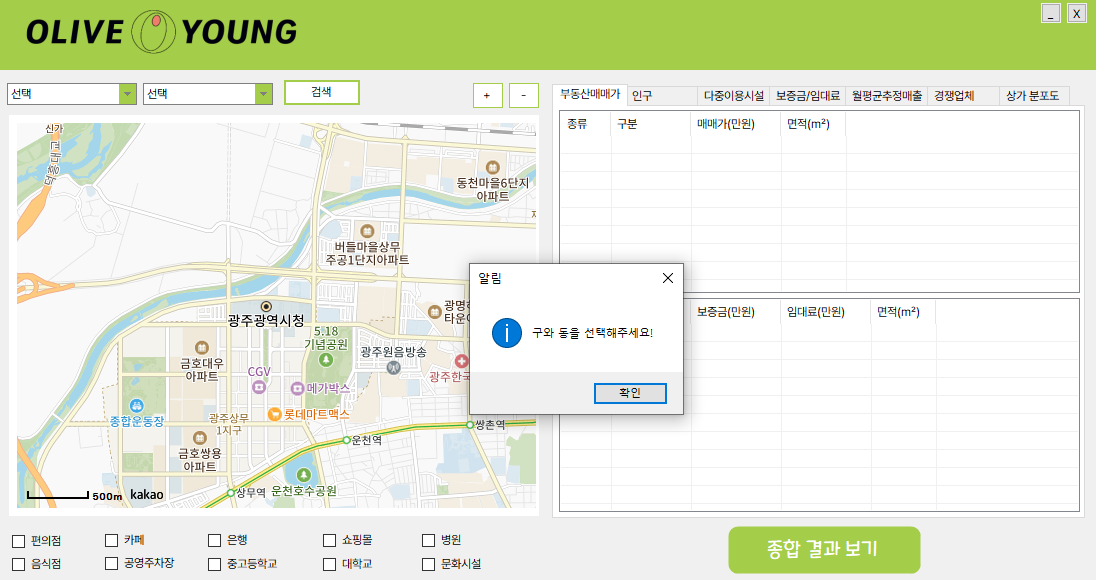
if (gu == "선택" | dong == "선택")
{
MessageBox.Show("구와 동을 선택해주세요!", "알림", MessageBoxButtons.OK, MessageBoxIcon.Information);
return;
}
// 클릭 됐는지 감지
clickDetected = true;
// 튜플에 값 넣기
Search(newAddr);
var sel = tuples[0];
// 위도, 경도 불러와서 이동
object[] arr = new object[] { sel.Item3, sel.Item2 }; // 위도, 경도
object res = webBrowser1.Document.InvokeScript("panTo", arr);
UpdateTabPage(gu, dong);
UpdatePictureBox(gu, dong);
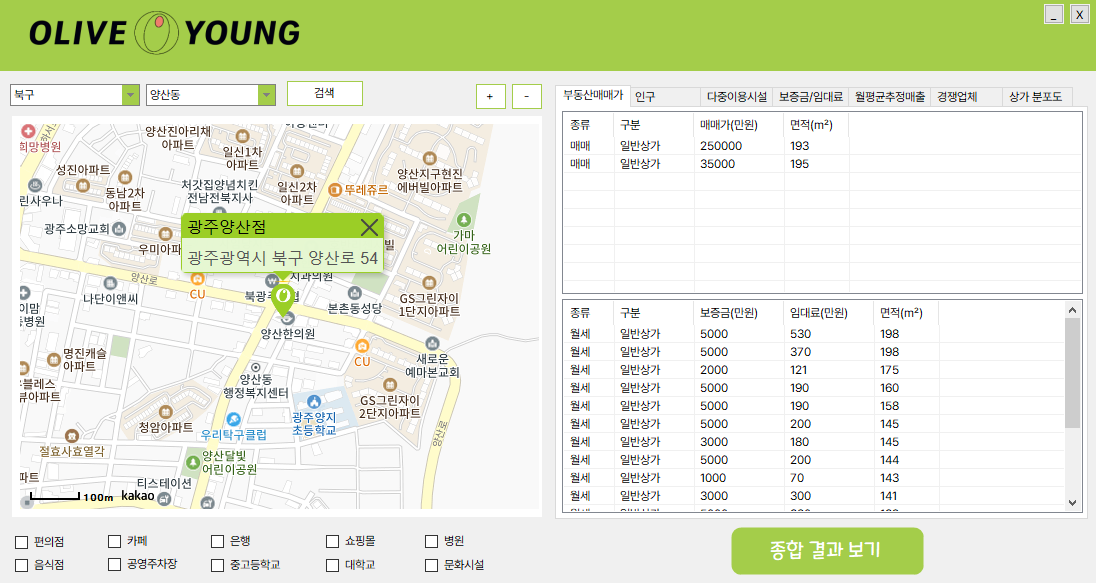
// 올리브영 위치 찍기
var columns = new List<string> { "LOC_NAME", "LOC_ADDR", "LOC_X", "LOC_Y" };
var condition = $"\"LOC_GU\" = '{gu}' AND \"LOC_DONG\" = \'{dong}\'";
var data = GetValuesFromMultipleColumns("TB_LOCATION", columns, condition, false);
StringBuilder jsCode = new StringBuilder();
jsCode.AppendLine($"remove_markers('olive_young');");
SetFontList();
if (data != null && data.Count > 0)
{
jsCode.AppendLine($"add_markers('olive_young', [");
foreach (var row in data)
{
string name = row["LOC_NAME"].ToString(); // 업체명
string addr = row["LOC_ADDR"].ToString(); // 주소
string x = row["LOC_X"].ToString(); //x좌표
string y = row["LOC_Y"].ToString(); //y좌표
Console.WriteLine(name + addr + x + y); // 확인용
// 각 시설의 정보를 바탕으로 JavaScript 코드를 추가
jsCode.AppendLine($"{{ title: '{name}', addr: '{addr}', latlng: new kakao.maps.LatLng({x}, {y}) }},");
}
jsCode.AppendLine("]);");
Console.WriteLine(jsCode.ToString());
// 생성된 JavaScript 코드를 웹 브라우저 컨트롤을 통해 실행
webBrowser1.Document.InvokeScript("eval", new object[] { jsCode.ToString() });
}
// 버스 위치 찍기
var busColumns = new List<string> { "BUS_NAME", "BUS_ADDR", "BUS_X", "BUS_Y" };
var busCondition = $"\"BUS_GU\" = '{gu}' AND \"BUS_DONG\" = \'{dong}\'";
var busData = GetValuesFromMultipleColumns("TB_BUS", busColumns, busCondition, false);
StringBuilder busJsCode = new StringBuilder();
busJsCode.AppendLine($"remove_markers('bus');");
if (busData != null && busData.Count > 0)
{
busJsCode.AppendLine($"add_markers('bus', [");
foreach (var row in busData)
{
string name = row["BUS_NAME"].ToString(); // 업체명
string addr = row["BUS_ADDR"].ToString(); // 주소
string x = row["BUS_X"].ToString(); //x좌표
string y = row["BUS_Y"].ToString(); //y좌표
Console.WriteLine(name + addr + x + y); // 확인용
// 각 시설의 정보를 바탕으로 JavaScript 코드를 추가
busJsCode.AppendLine($"{{ title: '{name}', addr: '{addr}', latlng: new kakao.maps.LatLng({x}, {y}) }},");
}
busJsCode.AppendLine("]);");
Console.WriteLine(busJsCode.ToString());
// 생성된 JavaScript 코드를 웹 브라우저 컨트롤을 통해 실행
webBrowser1.Document.InvokeScript("eval", new object[] { busJsCode.ToString() });
}
SetFontList();
//예상 창업 비용 작업 완
var columnsDeal = new List<string> { "DEAL_DEPOSIT", "DEAL_RENT_PRICE", "DEAL_SPACE" };
var conditionDeal = $"\"DEAL_TYPE\" = \'월세\' and \"DEAL_DONG\" = \'{dong}\'";
var dataDeal = GetValuesFromMultipleColumns("TB_DEAL", columnsDeal, conditionDeal, false);
int franchiseCost = 1100; // 가맹비
int premium = 10000; // 권리금
int furniture = 13000; // 집기비용
int systemCost = 1000; // 전산비용
int startGoods = 10000; // 초도상품구매비용
int workCost = 1200; // 공사비
int etc = 200; // 기타
int deposit = 0; // 보증금
int rentPrice = 0; // 임대료
float space = 0; // 면적
int interiorCost = 0; // 인테리어비 면적 // 3.3 * 198
List<int> depositList = new List<int>();
List<int> interiorList = new List<int>();
foreach (var row in dataDeal)
{
deposit = Convert.ToInt32(row["DEAL_DEPOSIT"]);
rentPrice = Convert.ToInt32(row["DEAL_RENT_PRICE"]);
space = Convert.ToSingle(row["DEAL_SPACE"]);
double result = space / 3.3 * 198;
interiorCost = Convert.ToInt32(result);
depositList.Add(deposit);
interiorList.Add(interiorCost);
}
int minDeposit = depositList.Count > 0 ? depositList.Min() : 0;
int maxDeposit = depositList.Count > 0 ? depositList.Max() : 0;
int minInteriorCost = interiorList.Count > 0 ? interiorList.Min() : 0;
int maxInteriorCost = interiorList.Count > 0 ? interiorList.Max() : 0;
int totalMin = franchiseCost + premium + furniture + systemCost + startGoods + workCost + etc + minDeposit + minInteriorCost;
int totalMax = franchiseCost + premium + furniture + systemCost + startGoods + workCost + etc + maxDeposit + maxInteriorCost;
string minCost = FormatWon(totalMin); // 최종 최소 금액
string maxCost = FormatWon(totalMax); // 최종 최고 금액
// ↓ 월평균매출, 유동인구 로직
string condition1 = $"\"FACILITY_GU\" = '{gu}' AND \"FACILITY_DONG\" = '{dong}'";
var faciltiyData = GetAllRowsFromTable("TB_FACILITY", condition1);
int facilityCnt = faciltiyData.Count(); // 다중이용시설 갯수
var salsesColumns = new List<string> { "SALES_INCOME", "SALES_PEOPLE" };
var salesCon = $"\"SALES_GU\" = '{gu}' AND \"SALES_DONG\" = '{dong}'";
var salesData = GetValuesFromMultipleColumns("TB_SALES", salsesColumns, salesCon, false);
// 월평균매출, 유동인구
string salesIncome = salesData[0]["SALES_INCOME"].ToString(); // 월평균매출
string salesPeople = salesData[0]["SALES_PEOPLE"].ToString(); // 유동인구
// 데이터 정규화 및 추천 기능 테이블
// List<string> Result = GetValuesFromTable("TB_RESULT", "RESULT_RATE", $"\"RESULT_GU\" = '{gu}' AND \"RESULT_DONG\" = '{dong}'", false);
var resultColumns = new List<string> { "RESULT_RATE", "RESULT_CNT" };
var result_ = GetValuesFromMultipleColumns("TB_RESULT", resultColumns, $"\"RESULT_GU\" = '{gu}' AND \"RESULT_DONG\" = '{dong}'", false);
string resultRate = result_[0]["RESULT_RATE"].ToString();
string resultCnt = result_[0]["RESULT_CNT"].ToString(); // 해당동의 올리브영 갯수
// 경쟁업체 수 조회
var competeColumns = new List<string> { "SALES_COMPETE" };
var competeQuery = GetValuesFromMultipleColumns("TB_SALES", competeColumns, $"\"SALES_GU\" = '{gu}' AND \"SALES_DONG\" = '{dong}'", false);
string resultCompete = competeQuery[0]["SALES_COMPETE"].ToString();
// 전역 변수에 할당
minCostValue_ = minCost;
maxCostValue_ = maxCost;
salesIncome_ = salesIncome;
salesPeople_ = salesPeople;
facilityCnt_ = facilityCnt.ToString();
resultRate_ = resultRate;
resultCnt_ = resultCnt;
resultCompete_ = resultCompete;
// 체크박스 비활성화 설정
checkBox1.Checked = false;
checkBox2.Checked = false;
checkBox3.Checked = false;
checkBox4.Checked = false;
checkBox5.Checked = false;
checkBox6.Checked = false;
checkBox7.Checked = false;
checkBox8.Checked = false;
checkBox9.Checked = false;
checkBox10.Checked = false;
SetFontList();
}
// ~억 ~만원 이라고 표현해주는 함수
static string FormatWon(int price)
{
int eok = price / 10000;
int man = (price / 10);
return $"{eok}억 {man}만원";
}
// 체크박스의 상태(선택/해제)에 따라 지도 상에 마커를 표시하거나 삭제
private void ShowCheckBoxMarkers(CheckBox checkBox)
{
List<Dictionary<string, object>> facility_rows = GetFacilitiesByTypeAndLocation(checkBox, flatComboBox1, flatComboBox2);
StringBuilder jsCode = new StringBuilder(); // JavaScript 코드를 동적으로 생성하기 위한 StringBuilder
string facilityType = checkBox.Tag.ToString(); //체크박스의 태그 값을 사용하여 시설 유형을 가져옴 -> ui에서 수정함
// 체크박스 선택되었을 때
if (checkBox.Checked)
{
jsCode.AppendLine($"add_markers('{facilityType}', [");
foreach (var row in facility_rows)
{
string name = row["FACILITY_NAME"].ToString(); // 업체명
string addr = row["FACILITY_ADDR"].ToString(); // 주소
string x = row["FACILITY_X"].ToString(); //x좌표
string y = row["FACILITY_Y"].ToString(); //y좌표
Console.WriteLine(name + addr + x + y); // 확인용
// // 각 시설의 정보를 바탕으로 JavaScript 코드를 추가
jsCode.AppendLine($"{{ title: '{name}', addr: '{addr}', latlng: new kakao.maps.LatLng({x}, {y}) }},");
}
jsCode.AppendLine("]);");
}
else // 체크박스 해제되었을 때 마커 삭제 명령 이동
{
jsCode.AppendLine($"remove_markers('{facilityType}');");
}
// 생성된 JavaScript 코드를 웹 브라우저 컨트롤을 통해 실행
webBrowser1.Document.InvokeScript("eval", new object[] { jsCode.ToString() });
}
// 체크박스의 이름을 참조해서 db에서 값을 가져온다.(인자: 체크박스, 구 콤보박스, 동 콤보박스)
private List<Dictionary<string, object>> GetFacilitiesByTypeAndLocation(CheckBox checkBox, ComboBox guComboBox, ComboBox dongComboBox)
{
// 데이터 가져옴
string facilityType = checkBox.Tag.ToString(); // Tag에서 시설 타입 가져오기
string gu = guComboBox.Text;
string dong = dongComboBox.Text;
string condition = "";
// 편의시설 합친 것 때문에 수정해줌
if (facilityType == "음식점")
{
condition = $"\"FACILITY_GU\" = '{gu}' AND \"FACILITY_DONG\" = '{dong}' AND \"FACILITY_TYPE\" IN ('음식점', '패스트푸드', '피자', '제빵', '음식점', '치킨', '분식', '술집')";
}
else if (facilityType == "쇼핑몰")
{
condition = $"\"FACILITY_GU\" = '{gu}' AND \"FACILITY_DONG\" = '{dong}' AND \"FACILITY_TYPE\" IN ('쇼핑몰', '할인점')";
}
else if (facilityType == "중고등학교")
{
condition = $"\"FACILITY_GU\" = '{gu}' AND \"FACILITY_DONG\" = '{dong}' AND \"FACILITY_TYPE\" IN ('중학교', '고등학교')";
}
else if (facilityType == "문화시설")
{
condition = $"\"FACILITY_GU\" = '{gu}' AND \"FACILITY_DONG\" = '{dong}' AND \"FACILITY_TYPE\" IN ('문화시설', '영화관')";
}
else
{
condition = $"\"FACILITY_GU\" = '{gu}' AND \"FACILITY_DONG\" = '{dong}' AND \"FACILITY_TYPE\" = '{facilityType}'";
}
return GetAllRowsFromTable("TB_FACILITY", condition);
}
private void resultButton_Click(object sender, EventArgs e)
{
if (flatComboBox1.Text == "선택" || flatComboBox2.Text == "선택")
{
MessageBox.Show("구와 동을 선택해주세요!", "알림", MessageBoxButtons.OK, MessageBoxIcon.Information);
}
else if (clickDetected == false)
{
MessageBox.Show("검색 버튼을 클릭해주세요!", "알림", MessageBoxButtons.OK, MessageBoxIcon.Information);
}
else
{
string guName = flatComboBox1.Text;
string dongName = flatComboBox2.Text;
DialogForm dialogForm = new DialogForm(guName, dongName, minCostValue_, maxCostValue_, salesIncome_, salesPeople_, facilityCnt_, resultRate_, resultCnt_, resultCompete_);
dialogForm.ShowDialog();
}
}
private void exitButton_Click(object sender, EventArgs e)
{
Close();
}
private void button1_Click(object sender, EventArgs e)
{
this.WindowState = FormWindowState.Minimized;
}
// 다중이용시설 체크박스 이벤트 연결
private void checkBox1_CheckedChanged(object sender, EventArgs e)
{
//편의점
ShowCheckBoxMarkers(sender as CheckBox);
}
private void checkBox2_CheckedChanged(object sender, EventArgs e)
{
//카페
ShowCheckBoxMarkers(sender as CheckBox);
}
private void checkBox3_CheckedChanged(object sender, EventArgs e)
{
//은행
ShowCheckBoxMarkers(sender as CheckBox);
}
private void checkBox4_CheckedChanged(object sender, EventArgs e)
{
//쇼핑몰
ShowCheckBoxMarkers(sender as CheckBox);
}
private void checkBox5_CheckedChanged(object sender, EventArgs e)
{
//병원
ShowCheckBoxMarkers(sender as CheckBox);
}
private void checkBox6_CheckedChanged(object sender, EventArgs e)
{
//음식점
ShowCheckBoxMarkers(sender as CheckBox);
}
private void checkBox7_CheckedChanged(object sender, EventArgs e)
{
//공용주차장
ShowCheckBoxMarkers(sender as CheckBox);
}
private void checkBox8_CheckedChanged(object sender, EventArgs e)
{
// 중 고등학교
ShowCheckBoxMarkers(sender as CheckBox);
}
private void checkBox9_CheckedChanged(object sender, EventArgs e)
{
// 대학교
ShowCheckBoxMarkers(sender as CheckBox);
}
private void checkBox10_CheckedChanged(object sender, EventArgs e)
{
//문화시설
ShowCheckBoxMarkers(sender as CheckBox);
}
private void MainForm_MouseDown(object sender, MouseEventArgs e)
{
if (e.Button == MouseButtons.Left)
{
offset = new Point(e.X, e.Y);
}
}
private void MainForm_MouseMove(object sender, MouseEventArgs e)
{
if (e.Button == MouseButtons.Left)
{
Point newLocation = this.Location;
newLocation.X += e.X - offset.X;
newLocation.Y += e.Y - offset.Y;
this.Location = newLocation;
}
}
private void label2_MouseDown(object sender, MouseEventArgs e)
{
if (e.Button == MouseButtons.Left)
{
offset = new Point(e.X, e.Y);
}
}
private void label2_MouseMove(object sender, MouseEventArgs e)
{
if (e.Button == MouseButtons.Left)
{
Point newLocation = this.Location;
newLocation.X += e.X - offset.X;
newLocation.Y += e.Y - offset.Y;
this.Location = newLocation;
}
}
}
}
DialogForm.cs
      <csharp />


      using System;
using System.Drawing;
using System.Windows.Forms;

namespace FranchiseProject
{
    public partial class DialogForm : Form
    {
        MainForm mainForm = new MainForm();

        // 마우스 드래그를 위한 offset 변수
        private Point offset;

        // 생성자
        public DialogForm(string guName,  // 구 이름
                          string dongName,  // 동 이름
                          string minCost,  // 최소 비용
                          string maxCost,  // 최대 비용
                          string salesIncome,  // 월 추정 매출
                          string salesPeople,  // 유동 인구 수
                          string facilityCnt,  // 다중 이용 시설 수
                          string resultRate,  // 적합 등급
                          string resultCnt,  // 올리브영 매장 수
                          string resultCompete  // 경쟁 업체 수
            )
        {
            InitializeComponent();
            SetGradePictureBox(resultRate);
            regionNameLabel.Text = $"{guName} {dongName} 지역의 분석 결과는...";
            mainLabel.Text = $"월 추정매출: {salesIncome}만원 \n 유동인구: {salesPeople}명 \n 다중 이용 시설 수: {facilityCnt}개 \n 경쟁업체 수: {resultCompete}개 \n 올리브영 매장 수: {resultCnt}개";
            finalLabel.Text = $"예상 창업 비용은 \n\n {minCost} ~ {maxCost}입니다.";

        }

        // gradePictureBox에 들어갈 이미지와 폰트 색상을 등급에 따라 결정합니다.
        private void SetGradePictureBox(string resultRate)
        {
            int grade = int.Parse(resultRate[0].ToString());
            gradePictureBox.Image = Properties.Resources.ResourceManager.GetObject($"_{grade}") as Image;

            // 0등급은 블랙 ~ 5등급 레드
            Color[] gradeColors = { Color.Black,  Color.Green, Color.LightGreen, Color.Orange, Color.OrangeRed, Color.Red };
            rateLabel.ForeColor = gradeColors[grade];
            rateLabel.Text = $"창업 적합도: {resultRate}";
        }

        // 닫기 버튼 함수
        private void exitButton_Click(object sender, EventArgs e)
        {
            Close();
        }

        // 다이얼로그 테두리 설정
        private void dialogForm_Paint(object sender, PaintEventArgs e)
        {
            ControlPaint.DrawBorder(e.Graphics, this.ClientRectangle,
                Color.Black, 2, ButtonBorderStyle.Solid,
                Color.Black, 2, ButtonBorderStyle.Solid,
                Color.Black, 2, ButtonBorderStyle.Solid,
                Color.Black, 2, ButtonBorderStyle.Solid);
        }

        private void DialogForm_Load(object sender, EventArgs e)
        {
            dialogTitleLabel.Font = new Font(FontManager.fontFamilys[0], 20, FontStyle.Regular, GraphicsUnit.Point, ((byte)(129)));
            regionNameLabel.Font = new Font(FontManager.fontFamilys[0], 15, FontStyle.Regular, GraphicsUnit.Point, ((byte)(129)));
            rateLabel.Font = new Font(FontManager.fontFamilys[0], 15, FontStyle.Bold, GraphicsUnit.Point, ((byte)(129)));
            mainLabel.Font = new Font(FontManager.fontFamilys[0], 13, FontStyle.Regular, GraphicsUnit.Point, ((byte)(129)));
            finalLabel.Font = new Font(FontManager.fontFamilys[0], 13, FontStyle.Bold, GraphicsUnit.Point, ((byte)(129)));
        }

        private void panel1_MouseDown(object sender, MouseEventArgs e)
        {
            if (e.Button == MouseButtons.Left)
            {
                offset = new Point(e.X, e.Y);
            }
        }

        private void panel1_MouseMove(object sender, MouseEventArgs e)
        {
            if (e.Button == MouseButtons.Left)
            {
                Point newLocation = this.Location;
                newLocation.X += e.X - offset.X;
                newLocation.Y += e.Y - offset.Y;
                this.Location = newLocation;
            }
        }

        private void DialogForm_MouseDown(object sender, MouseEventArgs e)
        {
            if (e.Button == MouseButtons.Left)
            {
                offset = new Point(e.X, e.Y);
            }
        }

        private void DialogForm_MouseMove(object sender, MouseEventArgs e)
        {
            if (e.Button == MouseButtons.Left)
            {
                Point newLocation = this.Location;
                newLocation.X += e.X - offset.X;
                newLocation.Y += e.Y - offset.Y;
                this.Location = newLocation;
            }
        }
    }
}
kakaoMap.html
더보기
<javascript /><!DOCTYPE html> <meta http-equiv="X-UA-Compatible" content="IE=edge"> <style type="text/css"> html, body { width: 99%; height: 98%; } .wrap { position: relative; /* 화살표(::after)의 위치를 부모 요소 기준으로 설정하기 위함 */ background-color: rgba(255, 234, 167, 0.9); /* 연한 주황/베이지 계열의 투명 배경 */ border: 1px solid rgb(255, 194, 0); /* 주어진 마커 색상으로 테두리 설정 */ border-radius: 5px; /* 둥근 모서리 */ box-shadow: 2px 2px 10px rgba(0, 0, 0, 0.2); /* 약간의 그림자 효과 */ } .wrap .info .title { color: rgb(0, 0, 0); /* 검은색 제목 */ background-color: rgb(255, 194, 0); /* 주어진 마커 색상으로 제목 배경 */ padding: 3px 5px; /* 제목의 안쪽 여백 */ border-radius: 3px 3px 0 0; /* 상단 둥근 모서리 */ font-family: 'Nanum Gothic', sans-serif; } .wrap .info .body .desc { color: rgb(84, 84, 84); /* 어두운 회색 텍스트 */ padding: 5px; /* 설명의 안쪽 여백 */ font-family: 'Nanum Gothic', sans-serif; } .wrap::after { content: ""; position: absolute; bottom: -10px; /* 화살표의 위치. 이 값을 조절하면 화살표 위치 변경 가능 */ left: 50%; /* 가운데 정렬을 위함 */ transform: translateX(-50%); /* 화살표를 완벽하게 중앙으로 위치시키기 위한 작업 */ width: 0; height: 0; border: 1px solid rgb(255, 194, 0); /* 주어진 마커 색상으로 테두리 설정 */ border-left: 10px solid transparent; /* 화살표의 크기와 모양 조절 */ border-right: 10px solid transparent; /* 화살표의 크기와 모양 조절 */ border-top: 10px solid rgba(255, 234, 167, 0.9); /* 화살표의 색상. 배경색과 동일하게 설정 */ border-top-color: inherit; /* 배경색과 동일하게 설정, JavaScript에서 변경되면 이에 맞춰 변경됨 */ } .info .close { position: absolute; top: 5px; right: 5px; color: #888; width: 17px; height: 17px; background: url('https://t1.daumcdn.net/localimg/localimages/07/mapapidoc/overlay_close.png'); } .info .body .desc { margin-top: 5px; } .ellipsis { overflow: hidden; text-overflow: ellipsis; white-space: nowrap; } </style> <html> <head> <meta charset="utf-8"> <title>지도 생성하기</title> </head> <body> <div id="map" style="width:100%; height:100%; "></div> <script type="text/javascript" src="https://dapi.kakao.com/v2/maps/sdk.js?appkey=9e002993cfb3567fac9baa79843a3852&libraries=services"></script> <script> var mapContainer = document.getElementById('map'), mapOption = { center: new kakao.maps.LatLng(35.1595454, 126.8526012), level: 6 }; var map = new kakao.maps.Map(mapContainer, mapOption); function moveTo(lat, lng) { //특정위치로 이동 var loc = new kakao.maps.LatLng(lat, lng); map.setCenter(loc); } function panTo(lat, lng) { // 부드럽게 이동 var loc = new kakao.maps.LatLng(lat, lng); map.panTo(loc); } function zoomIn() //줌인 { var level = map.getLevel(); map.setLevel(level - 1); } function zoomOut() //줌아웃 { var level = map.getLevel(); map.setLevel(level + 1); } // 모든 마커 삭제하는 함수 function clearMarkers() { for (var i = 0; i < markers.length; i++) { markers[i].setMap(null); } markers = []; // 배열 비우기 } // 체크박스 타입별로 마커를 관리하기 위한 객체 var markersByType = {}; function add_markers(type, data) { var imageSrc = "https://t1.daumcdn.net/localimg/localimages/07/mapapidoc/markerStar.png"; // 마커 이미지 원본 var infoBackgroundColor = "rgba(255, 234, 167, 0.9)"; // 기본 배경색 var titleBackgroundColor = "rgb(255, 194, 0)"; // 기본 제목 배경색 var arrowColor = "rgba(255, 234, 167, 0.9)"; // 화살표의 기본 색상 var imageSize = new kakao.maps.Size(45, 45); // 마커 크기 // 타입별로 이미지 URL을 객체에 저장 var imageSrcByType = { "편의점": "https://ifh.cc/g/xosnNw.png", "카페": "https://ifh.cc/g/aSthzv.png", "은행": "https://ifh.cc/g/okSGox.png", "쇼핑몰": "https://ifh.cc/g/6Lnbgc.png", "병원": "https://ifh.cc/g/WHpbDd.png", "음식점": "https://ifh.cc/g/Ayv1Oq.png", "공영주차장": "https://ifh.cc/g/BCOpkT.png", "중고등학교": "https://ifh.cc/g/lnpZAF.png", "대학교": "https://ifh.cc/g/BXcY85.png", "문화시설": "https://ifh.cc/g/w6dTZP.png", "bus": "https://ifh.cc/g/RpaT5V.png", "olive_young": "https://static.oliveyoung.co.kr/pc-static-root/image/store/point_way.png" }; //해당 타입의 이미지 URL 가져오기 var imageSrc = imageSrcByType[type]; // type이 'olive_young'일 경우 변경사항 if (type === "olive_young") { imageSrc = "https://static.oliveyoung.co.kr/pc-static-root/image/store/point_way.png"; // 올리브영 마커 infoBackgroundColor = "rgba(230, 248, 210, 0.9)"; // 연두색의 연한 톤 배경색 titleBackgroundColor = "rgb(155, 206, 38)"; // 연두색 arrowColor = "rgba(230, 248, 210, 0.9)"; // 연두색의 연한 톤 화살표 색상 var imageSize = new kakao.maps.Size(24, 35); // 마커 크기 } if (!markersByType[type]) { markersByType[type] = []; } // for문 돌려서 마커 하나씩 추가해주기 for (var i = 0; i < data.length; i++) { var markerImage = new kakao.maps.MarkerImage(imageSrc, imageSize); // 이미지 사이즈 var addr = data[i].addr; // 주소 var marker = new kakao.maps.Marker({ map: map, // 담길 지도 position: data[i].latlng, // 위경도 title: data[i].title, // 상호명 image: markerImage // 마커 이미지 }); // 마커에 담길 내용 var content = '<div class="wrap" style="background-color:' + infoBackgroundColor + '; border-color:' + titleBackgroundColor + '">' + ' <div class="info" style="background-color:' + infoBackgroundColor + '">' + ' <div class="title" style="background-color:' + titleBackgroundColor + '">' + data[i].title + ' <div class="close" onclick="closeOverlay(\'' + type + '\', ' + i + ')" title="닫기"></div>' + ' </div>' + ' <div class="body">' + ' <div class="desc">' + ' <div class="ellipsis">' + data[i].addr + '</div>' + ' </div>' + ' </div>' + ' </div>' + '</div>'; // 오버레이(뒤에 담기는 메세지박스) var overlay = new kakao.maps.CustomOverlay({ content: content, position: marker.getPosition(), yAnchor: 1.75 // 이 값을 조정하여 오버레이의 위치를 위로 올리거나 내릴 수 있음 -> 깎아야 함 }); // 마커와 오버레이 설정해 줌 markersByType[type].push({ marker: marker, overlay: overlay }); (function (type, marker, overlay) { kakao.maps.event.addListener(marker, 'click', function (mouseEvent) { for (var j = 0; j < markersByType[type].length; j++) { markersByType[type][j].overlay.setMap(null); // 모든 오버레이 숨기기 } overlay.setMap(map); // 클릭한 마커의 오버레이만 보이기 }); })(type, marker, overlay); // 버스 마커 줌 크기에 따라 숨기기 kakao.maps.event.addListener(map, 'zoom_changed', function () { // 현재 줌 레벨을 가져옴 var zoomLevel = map.getLevel(); if (zoomLevel <= 4) { // 줌 레벨이 4 이하면 (확대 상태) // 모든 마커 숨기기 for (var i = 0; i < markersByType['bus'].length; i++) { markersByType['bus'][i].marker.setMap(null); } } else { // 줌 레벨이 4 초과면 (축소 상태) // 모든 버스 마커 보이게 하기 for (var i = 0; i < markersByType['bus'].length; i++) { markersByType['bus'][i].marker.setMap(map); } } } }); } } /*여기서 오류가 뜸 여기서 오류가 뜸 -- 해결*/ //마커의 커스텀 오버레이를 닫기 위해 호출되는 함수 function closeOverlay(type, index) { if (markersByType[type] && markersByType[type][index]) { markersByType[type][index].overlay.setMap(null); } } // 사용안함(hover 할때 사용하는 부분) function makeOverListener(map, marker, infowindow) { return function () { infowindow.open(map, marker); }; } function makeOutListener(infowindow) { return function () { infowindow.close(); }; } // 마커 모두 지우기 function remove_markers(type) { if (markersByType[type]) { for (var i = 0; i < markersByType[type].length; i++) { markersByType[type][i].marker.setMap(null); // 변경된 부분 if (markersByType[type][i].overlay) { // overlay도 존재한다면 markersByType[type][i].overlay.setMap(null); // overlay도 지웁니다. } } markersByType[type] = []; } } </script> </body> </html>
draw_circle_graph.py
더보기
<javascript />
import pandas as pd
import matplotlib.pyplot as plt
import pandas as pd
import psycopg2
import os
# 글씨체 설정
plt.rcParams['axes.unicode_minus'] =False
plt.rcParams['font.family'] ='Malgun Gothic'
# db 호출
host = '10.10.20.103' # 데이터베이스 호스트 주소
database = 'franchise' # 데이터베이스 이름
user = 'postgres' # 데이터베이스 사용자 이름
password = '1234' # 데이터베이스 비밀번호
port = 5432 # 포트번호
conn = psycopg2.connect(host=host, database=database, user=user, password=password, port=port)
cur = conn.cursor()
def create_donut_chart(dong, todo_cnt: list):
sizes = todo_cnt
labels = ['10대', '20대', '30대', '기타']
colors = ['#ff9999', '#66b3ff', '#99ff99', '#ffcc99', '#c2c2f0']
colors_ = ['#0F9B58', '#0FBC74', '#53B83A', '#3EC56B', '#1AA867', '#0FAF52', '#0FAF6B', '#53AF37']
olive_color = ['#A4CD4A', '#FFC300', '#89CFF0', '#800080', '#AA0000']
# 비율에 따라 도넛 모양으로 그래프 그리기
plt.pie(sizes, labels=labels, colors=olive_color, autopct='%1.1f%%', startangle=90, wedgeprops=dict(width=0.4))
# 도넛 모양으로 그래프 그리기
centre_circle = plt.Circle((0, 0), 0.70, fc='white')
fig = plt.gcf()
fig.gca().add_artist(centre_circle)
# 모두 동일한 비율로 그리기
plt.axis('equal')
plt.title(f"{dong} 인구 비율")
### 이미지 저장
# 현재 경로를 얻습니다.
current_path = os.getcwd()
# 현재 경로 내에 'graph_pic' 폴더를 만듭니다.
graph_folder = os.path.join(current_path, 'graph_pic')
# 해당 폴더가 없으면 생성합니다.
if not os.path.exists(graph_folder):
os.makedirs(graph_folder)
# 그림을 저장할 전체 경로를 설정합니다.
save_path = os.path.join(graph_folder, f'{dong}_인구비율.png')
fig.savefig(save_path)
plt.close(fig)
plt.show()
def return_specific_data():
query = f"SELECT * FROM public.\"TB_POPULATION\" ;"
cur.execute(query)
data = cur.fetchall()
gwangju_data = dict()
for d in data:
if d[1] not in gwangju_data.keys():
gwangju_data[d[1]] = []
if d[2] not in gwangju_data[d[1]]:
gwangju_data[d[1]].append(d[2])
dong_list = list(gwangju_data.values())
dong_list_ = []
for list_ in dong_list:
if type(list_) == list:
dong_list_.extend(list_)
print(dong_list_)
for dong in dong_list_:
return_data_by_dong(dong)
def return_data_by_dong(dong):
query = f"SELECT * FROM public.\"TB_POPULATION\" WHERE \"POP_DONG\" = '{dong}';"
print(query)
cur.execute(query)
data = cur.fetchall()
print(data)
data = data[0]
id = data[0]
gu = data[1]
dong = data[2]
teen = data[3] + data[4]
twenty = data[5] + data[6]
thirty = data[7] + data[8]
etc_ = data[9]
create_donut_chart(dong=dong, todo_cnt=[teen, twenty, thirty, etc_])
conn.commit()
return_specific_data()
cur.close()
conn.close()
import psycopg2
import matplotlib.pyplot as plt
import matplotlib.colors as mcolors
import pandas as pd
import numpy as np
import os
plt.rcParams['font.family'] = 'Malgun Gothic'
plt.rcParams['axes.unicode_minus'] = False
host = '10.10.20.103' # 데이터베이스 호스트 주소
database = 'franchise' # 데이터베이스 이름
user = 'postgres' # 데이터베이스 사용자 이름
password = '1234' # 데이터베이스 비밀번호
port = 5432 # 포트번호
conn = psycopg2.connect(host=host, database=database, user=user, password=password, port=port)
cur = conn.cursor()
class Graph:
# 도넛 모양으로 그래프 그려주는 함수
def create_donut_chart(self, gu, dong, todo_cnt: list):
sizes = todo_cnt
labels = ['10대', '20대', '30대', '기타']
# 색 설정
colors = ['#ff9999', '#66b3ff', '#99ff99', '#ffcc99', '#c2c2f0']
# colors_ = ['#0F9B58', '#0FBC74', '#53B83A', '#3EC56B', '#1AA867', '#0FAF52', '#0FAF6B', '#53AF37']
olive_color = ['#A4CD4A', '#FFC300', '#89CFF0', '#800080', '#AA0000']
pastel_color_ = ['#B2F2BB', '#FFF5B1', '#AEDFF7', '#AFEEF2', '#FFDAC1']
# pastel_color = ['#B2E09B', '#C1E5A9', '#AEDF93', '#BCE6B4', '#C8EDC7']
# 비율에 따라 도넛 모양으로 그래프 그리기
plt.pie(sizes, labels=labels, colors=colors, autopct='%1.1f%%', startangle=90, wedgeprops=dict(width=0.4))
# 도넛 모양으로 그래프 그리기
centre_circle = plt.Circle((0, 0), 0.70, fc='white')
fig = plt.gcf()
fig.gca().add_artist(centre_circle)
# 모두 동일한 비율로 그리기
plt.axis('equal')
# 제목
plt.title(f"{gu} {dong} 인구 비율")
plt.show() # 그래프 띄우기
# 그래프 저장(show와 동시에 못 사용함)
# save_graph(gu, dong, 'sample_folder')
# 행정동별 타겟인구수
def TARGET_POPULATION_ADMINISTRATIVE_DONG(self):
query = f"SELECT * FROM public.\"TB_POPULATION\" ;"
cur.execute(query)
data = cur.fetchall()
gwangju_data = {'광산구': [], '남구': [], '동구': [], '북구': [], '서구': []}
for d in data:
if d[2] not in gwangju_data.values():
if d[1] == '광산구':
gwangju_data['광산구'].append(d[2])
if d[1] == '남구':
gwangju_data['남구'].append(d[2])
if d[1] == '동구':
gwangju_data['동구'].append(d[2])
if d[1] == '북구':
gwangju_data['북구'].append(d[2])
if d[1] == '서구':
gwangju_data['서구'].append(d[2])
print(gwangju_data)
keys = list(gwangju_data.keys())
for i in gwangju_data:
for j in gwangju_data[i]:
print(i, j)
return_data_by_dong(i, j)
# 행정동별 인구수 리턴값
def return_data_by_dong(gu, dong):
query = f"SELECT * FROM public.\"TB_POPULATION\" WHERE \"POP_GU\" = '{gu}' AND \"POP_DONG\" = '{dong}';"
print(query)
cur.execute(query)
data = cur.fetchall()
print(data)
data = data[0]
id = data[0]
gu_ = data[1]
dong_ = data[2]
teen = data[3] + data[4]
twenty = data[5] + data[6]
thirty = data[7] + data[8]
etc_ = data[9]
print(id, gu_, dong_, teen, twenty, thirty, etc_)
create_donut_chart(gu=gu_, dong=dong_, todo_cnt=[teen, twenty, thirty, etc_])
# 행정동별 월평균추정매출과 경쟁업체
def AVERAGE_MONTHLY_ESTIMATED_SALES_COMPETITORS(self):
sql_income = "select * from \"TB_SALES\" where \"SALES_GU\" = '북구'"
cur.execute(sql_income)
datas = cur.fetchall()
dong_list = list()
income_list = list()
compete_list = list()
for data in datas:
dong = data[2]
income = data[3]
compete = data[4]
if income != 0:
dong_list.append(dong)
income_list.append(income)
compete_list.append(compete)
x_value = np.array(dong_list)
y1 = np.array(income_list)
y2 = np.array(compete_list)
fig, ax1 = plt.subplots()
ax1.plot(x_value, y1, '-o', color='black', markersize=5, linewidth=3, alpha=0.7, label='월평균추정매출')
ax1.set_xlabel('행정동')
ax1.set_ylabel('행정동별 월평균추정매출')
ax1.tick_params(axis='both', direction='in')
ax2 = ax1.twinx()
ax2.bar(x_value, y2, color='deeppink', label='경쟁업체 수', alpha=0.7, width=0.7)
ax2.set_ylabel('동일업종 경쟁업체')
ax2.tick_params(axis='y', direction='in')
ax1.set_zorder(ax2.get_zorder() + 10)
ax1.patch.set_visible(False)
ax1.legend(loc='upper left')
ax2.legend(loc='upper right')
plt.title("행정동별 월평균추정매출과 경쟁업체")
plt.show()
# 행정동별 동일업종 월평균추정매출
def AVERAGE_MONTHLY_ESTIMATED_SALES_SAME_INDUSTRY(self):
"""행정동별 동일업종 월평균추정매출"""
sql_dong = "select * from \"TB_SALES\" where \"SALES_GU\" = '광산구' order by \"SALES_DONG\" asc"
cur.execute(sql_dong)
dong_datas = cur.fetchall()
sql_pop = "select * from \"TB_POPULATION\" where \"POP_GU\" = '광산구' order by \"POP_DONG\" asc"
cur.execute(sql_pop)
pop_datas = cur.fetchall()
dong_list = list()
income_list = list()
for data in dong_datas:
dong = data[2]
income = data[3]
if income == 0:
pass
else:
dong_list.append(dong)
income_list.append(income)
target_list = list()
etc_list = list()
for data in pop_datas:
dong = data[2]
target_age = sum(data[3:9])
etc_age = data[-1]
if dong not in dong_list:
pass
else:
target_list.append(target_age)
etc_list.append(etc_age)
x = np.array(dong_list)
bar = np.array(income_list)
line = np.array(target_list)
plt.rcParams['figure.figsize'] = (4, 3)
plt.rcParams['font.size'] = 12
x = np.array(dong_list)
y1 = np.array(income_list)
y2 = np.array(target_list)
fig, ax1 = plt.subplots()
ax1.plot(x, y1, '-s', color='green', markersize=7, linewidth=5, alpha=0.7, label='Price')
ax1.set_xlabel('행정동')
ax1.set_ylabel('동일업종 월평균추정매출')
ax1.tick_params(axis='both', direction='in')
ax2 = ax1.twinx()
ax2.bar(x, y2, color='deeppink', label='Demand', alpha=0.7, width=0.7)
ax2.set_ylabel("행정동별 1030 인구")
ax2.tick_params(axis='y', direction='in')
plt.show()
# 다중이용시설 그래프
def MULTI_USE_FACILITY_GRAPH(self):
# 색상 설정
color_list = ['#FFD1DC', '#AEDFF7', '#DCAEFE', '#B2F2BB', '#FFAD9F', '#FFDAC1', '#FFF5B1', '#AFEEF2',
'#FFE5B4', '#CBA3FF', '#FFB3BA', '#BAE1FF', '#FFE0B5', '#D1A3FF', '#A8FFD9']
# 테이블 불러오기
qurey = "select \"GU_NAME\", \"H_DONG_NAME\" from \"TB_DONG\""
cur.execute(qurey)
dong_datas = cur.fetchall()
facilty_dict = dict()
for data in dong_datas:
gu = data[0]
dong = data[1]
if not gu in facilty_dict.keys():
facilty_dict[gu] = []
if dong not in facilty_dict[gu]:
facilty_dict[gu].append(dong)
print(facilty_dict)
gu_list = list(facilty_dict.keys())
for gu in gu_list:
for dong in facilty_dict[gu]:
sql_facility = f"select \"FACILITY_TYPE\", count(\"FACILITY_DONG\") from \"TB_FACILITY\" where \"FACILITY_GU\" = '{gu}' and \"FACILITY_DONG\" = '{dong}' group by \"FACILITY_TYPE\" "
print(sql_facility)
cur.execute(sql_facility)
datas = cur.fetchall()
# 다중이용시설, 값 담는 리스트
facility_list = list()
count_list = list()
# 데이터 리스트에 추가하기
for data in datas:
# print(data)
facility_type, facility_count = data[0], data[1]
facility_list.append(facility_type)
count_list.append(facility_count)
print(facility_list, count_list)
x_lables = np.arange(len(facility_list))
facility = facility_list
cnt = count_list
# 제목 설정
plt.title(f"{gu} {dong} 다중이용시설")
# 그래프 색상 적용
plt.bar(x_lables, cnt, color=color_list[:len(facility_list)])
# 그래프에 값 넣기
for i in range(len(cnt)):
plt.text(x_lables[i], cnt[i] - 0.5, str(cnt[i]), ha='center', fontsize=10, color='black')
# 그래프 그리기
# y축 값 설정
if max(cnt) > 20:
plt.yticks(np.arange(0, max(cnt) + 1, 5)) # 5 단위로 나눔
else:
plt.yticks(np.arange(0, max(cnt) + 1, 1)) # 1 단위로 나눔
plt.xticks(x_lables, facility)
plt.xticks(rotation=30) # x 스틱 회전
# plt.show()
# plt.yticks(np.arange(min(cnt), max(cnt) + 1, step=1))
plt.show()
# 행정동별 면적 범위별 평균 보증금과 임대료
def AVERAGE_WARRANTY_AREA_RANGE(self):
sql_gu = 'select distinct "H_DONG_NAME", "GU_NAME" from "TB_DONG"'
cur.execute(sql_gu)
datas = cur.fetchall()
for data in datas:
dong_name = data[0]
gu_name = data[1]
sql_deal = f"select * from \"TB_DEAL\" where \"DEAL_DONG\" = '{dong_name}' and \"DEAL_TYPE\" = '월세'"
cur.execute(sql_deal)
deal_datas = cur.fetchall()
area_list = ['105 ~ 120', "121 ~ 135", '136 ~ 150', '151 ~ 165', '166 ~ 180', '181 ~ 200']
deposit_1 = list()
deposit_2 = list()
deposit_3 = list()
deposit_4 = list()
deposit_5 = list()
deposit_6 = list()
rent_1 = list()
rent_2 = list()
rent_3 = list()
rent_4 = list()
rent_5 = list()
rent_6 = list()
for deal_data in deal_datas:
# dong = data[4]
deposit = deal_data[-4]
rent = deal_data[-3]
area = deal_data[-1]
if rent != None:
if 105 <= area < 121:
rent_1.append(rent)
deposit_1.append(deposit)
elif 121 <= area < 136:
rent_2.append(rent)
deposit_2.append(deposit)
elif 135 <= area < 151:
rent_3.append(rent)
deposit_3.append(deposit)
elif 150 <= area < 166:
rent_4.append(rent)
deposit_4.append(deposit)
elif 166 <= area < 181:
rent_5.append(rent)
deposit_5.append(deposit)
elif 180 <= area < 201:
rent_6.append(rent)
deposit_6.append(deposit)
avr_deposit = [self.calculate_average(deposit_list) for deposit_list in
[deposit_1, deposit_2, deposit_3, deposit_4, deposit_5, deposit_6]]
avr_rent = [self.calculate_average(rent_list) for rent_list in
[rent_1, rent_2, rent_3, rent_4, rent_5, rent_6]]
avr_deposit = [0 if np.isnan(value) else value for value in avr_deposit]
avr_rent = [0 if np.isnan(value) else value for value in avr_rent]
fig, ax1 = plt.subplots()
ax1.plot(area_list, avr_deposit, '-o', color='#387D32', markersize=5, linewidth=3, alpha=0.7, label='평균 보증금')
ax1.set_xlabel('면적')
ax1.set_ylabel('범위별 평균 보증금')
ax2 = ax1.twinx()
# 그래프 색상 적용
bar_color = '#A4CD4A'
line_color = '#387D32' # 진한 녹색
ax2.bar(area_list, avr_rent, color=bar_color, label='평균 임대료', alpha=0.7, width=0.7)
# ax2.bar(area_list, avr_rent, color=color_list[:len(datas)], label='평균 임대료', alpha=0.7, width=0.7)
for i, value in enumerate(avr_rent):
# ax2.bar(area_list[i], value, color=color_list[i], label=area_list[i], alpha=0.7, width=0.7)
if round(avr_rent[i]) != 0:
plt.text(area_list[i], avr_rent[i] - 10, str(round(avr_rent[i])), ha='center', fontsize=11,
color='black', fontweight='bold')
# ax2.bar(area_list, avr_rent, color='deeppink', label='평균 임대료', alpha=0.7, width=0.7)
ax2.set_ylabel('범위별 평균 임대료')
ax1.set_zorder(ax2.get_zorder() + 10)
ax1.patch.set_visible(False)
ax1.legend(loc='upper left')
ax2.legend(loc='lower right')
# yticks 설정
if max(avr_deposit) == 0:
ax1.set_yticks(np.arange(0, 1000, step=100))
if max(avr_rent) == 0:
ax2.set_yticks(np.arange(0, 1000, step=100))
plt.title(f"{gu_name} {dong_name} 면적 범위별 평균 보증금과 임대료")
self.save_graph(gu=gu_name, dong=dong_name, folder="구동별 보증금임대료")
plt.show()
# 그래프 저장하는 함수
def SAVE_GRAPH(self, gu, dong, folder):
"""
:param gu: 구 이름
:param dong: 동 이름
:param folder: 저장할 폴더
:return:
"""
# 그래프 저장
# 현재 경로를 얻습니다.
current_path = os.getcwd()
# 현재 경로 내에 'facility_pic' 폴더를 생성
graph_folder = os.path.join(current_path, f'{folder}')
# 해당 폴더가 없으면 생성
if not os.path.exists(graph_folder):
os.makedirs(graph_folder)
# 그림을 저장할 전체 경로를 설정
fig = plt.gcf()
save_path = os.path.join(graph_folder, f"{gu}_{dong}")
fig.savefig(save_path)
plt.close(fig)
def calculate_average(self, data_list):
"""평균값 반환하는 함수"""
valid_data = [value for value in data_list if value is not None and not np.isnan(value)]
return np.mean(valid_data)
# 구별 1030 인구대비 월평균추정매출
def MONTHLY_SALES_RELATIVE_POPULATION_DISTINCTION(self):
gu_list = ['광산구', '북구', '남구', '동구', '서구']
for gu_name in gu_list:
sql_dong = f"select * from \"TB_SALES\" where \"SALES_GU\" = '{gu_name}' order by \"SALES_DONG\" asc"
cur.execute(sql_dong)
dong_datas = cur.fetchall()
sql_pop = f"select * from \"TB_POPULATION\" where \"POP_GU\" = '{gu_name}' order by \"POP_DONG\" asc"
cur.execute(sql_pop)
pop_datas = cur.fetchall()
dong_list = list()
income_list = list()
for data in dong_datas:
dong = data[2]
income = data[3]
if income == 0:
pass
else:
dong_list.append(dong)
income_list.append(income)
target_list = list()
etc_list = list()
for data in pop_datas:
dong = data[2]
target_age = sum(data[3:9])
etc_age = data[-1]
if dong not in dong_list:
pass
else:
target_list.append(target_age)
etc_list.append(etc_age)
x = np.array(dong_list)
bar = np.array(income_list)
line = np.array(target_list)
plt.rcParams['figure.figsize'] = (4, 3)
plt.rcParams['font.size'] = 12
x = np.array(dong_list)
y1 = np.array(income_list)
y2 = np.array(target_list)
# 화면 크기 조정
# fig, ax1 = plt.subplots()
fig, ax1 = plt.subplots(figsize=(9, 5))
# 색상 설정
color_list = ['#FFD1DC', '#AEDFF7', '#DCAEFE', '#B2F2BB', '#FFAD9F', '#FFDAC1', '#FFF5B1', '#AFEEF2',
'#FFE5B4', '#CBA3FF', '#FFB3BA', '#BAE1FF', '#FFE0B5', '#D1A3FF', '#A8FFD9']
ax1.plot(x, y1, '-s', color='#2E4053', markersize=7, linewidth=4, alpha=0.7, label='Price') # 검정
# ax1.plot(x, y1, '-s', color='#387D32', markersize=7, linewidth=5, alpha=0.7, label='Price') # 녹색
ax1.set_xlabel('행정동')
ax1.set_ylabel('동일업종 월평균추정매출')
ax1.tick_params(axis='both', direction='in')
ax1.set_xticks(np.arange(len(dong_list))) # 틱의 위치 설정
ax1.set_xticklabels(dong_list, rotation=45) # 회전을 적용하여 x-axis 레이블을 설정
ax2 = ax1.twinx()
ax2.set_ylabel('10대 ~ 30대 인구수')
bar_color = '#A4CD4A'
line_color = '#387D32' # 진한 녹색
for i, value in enumerate(y2):
ax2.bar(x[i], y2[i], color=color_list[i % len(color_list)], alpha=0.7, width=0.7) # 파스텔
# ax2.bar(x[i], y2[i], color='#A4CD4A', alpha=0.7, width=0.7) # 녹색
if round(y2[i]) != 0:
plt.text(x[i], y2[i] + 5, str(round(y2[i])),
ha='center', fontsize=11, color='black',
fontweight='bold', zorder=3) # y 위치를 조정하고 zorder 추가
ax1.set_zorder(ax2.get_zorder() + 10)
ax1.patch.set_visible(False)
plt.xticks(rotation=45) # x 스틱 회전
ax2.tick_params(axis='y', direction='in')
plt.title(f'{gu_name} 1030 인구대비 월평균추정매출')
plt.show()
# 행정동별 월평균추정매출
def MONTHLY_AVERAGE_ESTIMATED_SALES_ADMINISTRATIVE_DISTRICT(self):
gu_list = ['광산구', '북구', '남구', '서구', '동구']
for gu_name in gu_list:
sql_income = f"select * from \"TB_SALES\" where \"SALES_GU\" = '{gu_name}'"
cur.execute(sql_income)
datas = cur.fetchall()
dong_list = list()
income_list = list()
compete_list = list()
for data in datas:
dong = data[2]
income = data[3]
compete = data[4]
if income != 0:
dong_list.append(dong)
income_list.append(income)
compete_list.append(compete)
x_value = np.array(dong_list)
y1 = np.array(income_list)
y2 = np.array(compete_list)
# fig, ax1 = plt.subplots()
fig, ax1 = plt.subplots(figsize=(9, 5))
ax1.plot(x_value, y1, '-o', color='#2E4053', markersize=5, linewidth=3, alpha=0.7, label='월평균추정매출')
ax1.set_xlabel('행정동')
ax1.set_ylabel('행정동별 월평균추정매출')
ax1.tick_params(axis='both', direction='in')
ax2 = ax1.twinx()
# 색상 설정
color_list = ['#FFD1DC', '#AEDFF7', '#DCAEFE', '#B2F2BB', '#FFAD9F', '#FFDAC1', '#FFF5B1', '#AFEEF2',
'#FFE5B4', '#CBA3FF', '#FFB3BA', '#BAE1FF', '#FFE0B5', '#D1A3FF', '#A8FFD9']
for i, value in enumerate(y2):
label = '동일업종 경쟁업체' if i == 0 else None # 첫 번째 바에만 라벨을 지정
ax2.bar(x_value[i], y2[i], color=color_list[i % len(color_list)], alpha=0.7, width=0.7, label=label)
if round(y2[i]) != 0:
plt.text(x_value[i], y2[i], str(round(y2[i])),
ha='center', fontsize=11, color='black',
fontweight='bold', zorder=2) # y 위치를 조정하고 zorder 추가
# ax2.bar(x_value, y2, color='deeppink', label='경쟁업체 수', alpha=0.7, width=0.7)
ax2.set_ylabel('동일업종 경쟁업체')
# ax2.tick_params(axis='y', direction='in')
# x축 틱 위치와 레이블을 설정합니다.
ax1.set_xticks(np.arange(len(x_value)))
ax1.set_xticklabels(x_value, rotation=45)
ax2.tick_params(axis='y', direction='in')
# plt.xticks(rotation=45) # x 스틱 회전
ax1.set_zorder(ax2.get_zorder() + 10)
ax1.patch.set_visible(False)
ax1.legend(loc='upper left')
ax2.legend(loc='upper right')
plt.title(f"{gu_name} 월평균추정매출과 경쟁업체")
# 그래프 저장
# 현재 경로를 얻습니다.
current_path = os.getcwd()
# 현재 경로 내에 'facility_pic' 폴더를 생성
graph_folder = os.path.join(current_path, '월평균추정매출과 경쟁업체')
# 해당 폴더가 없으면 생성
if not os.path.exists(graph_folder):
os.makedirs(graph_folder)
# 그림을 저장할 전체 경로를 설정
fig = plt.gcf()
save_path = os.path.join(graph_folder, f"{gu_name} 월평균추정매출과 경쟁업체")
fig.savefig(save_path)
plt.close(fig)
# plt.show()
plt.show()
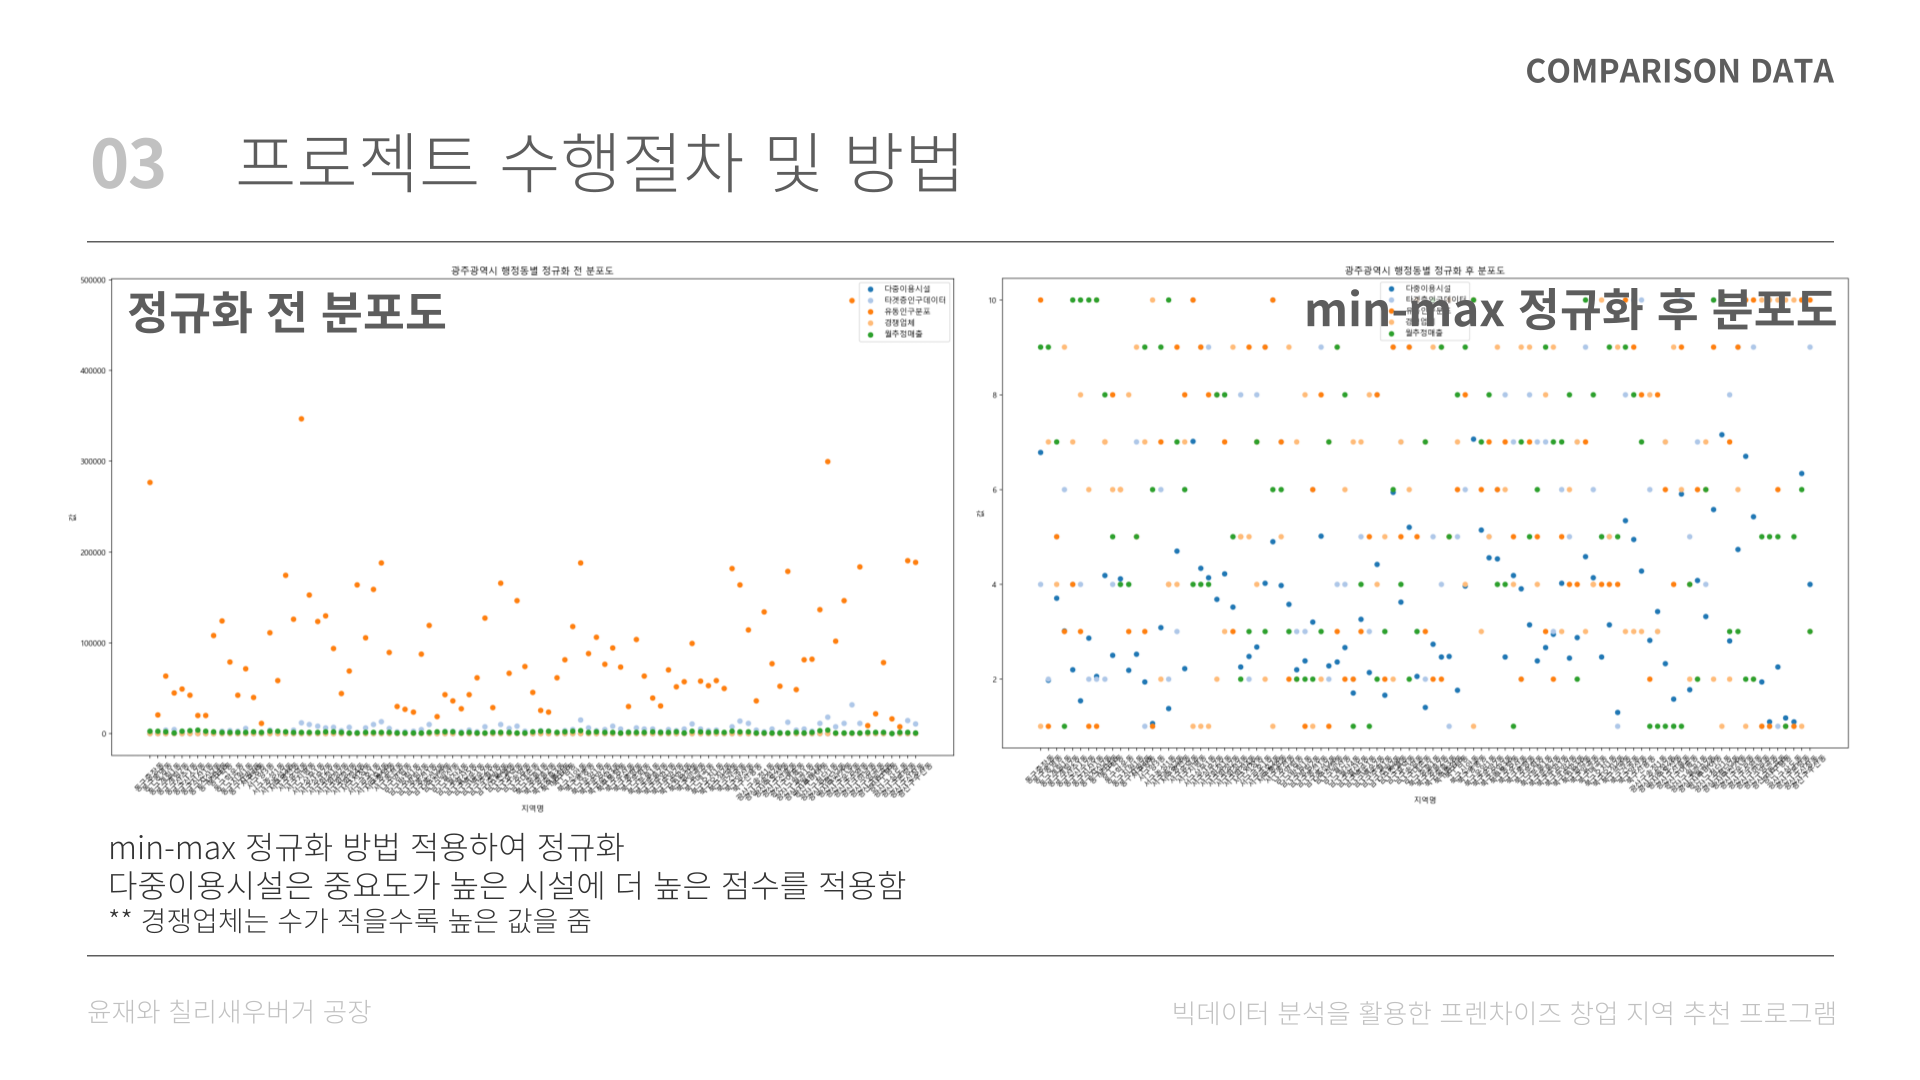
# 정규화 전 분포도 그리기
def PRE_NORMALIZATION_GRAPH(self):
df = pd.read_csv('정규화전.csv')
areas = df['구동'].tolist()
# 나머지 열은 각 카테고리에 해당하는 값
categories = df.columns[1:].tolist()
# 컬러맵 설정
colormap = plt.cm.tab20
color_list = [colormap(i) for i in range(len(categories))]
color_list
# colors = ['red', 'blue', 'green']
fig, ax = plt.subplots(figsize=(16, 10))
# 각 지역에 대한 산점도 그리기
for idx, category in enumerate(categories):
y_values = df[category].tolist()
ax.scatter(areas, y_values, color=color_list[idx], label=category)
ax.set_ylabel('값')
ax.set_xlabel('지역명')
ax.set_title('지역별 카테고리 값(정규화 전)')
ax.legend()
plt.xticks(rotation=45)
plt.tight_layout()
plt.show()
# 정규화 이후 분포도 그리기
def GRAPHS_NORMALIZATION_GRAPH(self):
df2 = pd.read_csv('정규화후.csv')
# df2
areas = df2['구동'].tolist()
# 나머지 열은 각 카테고리에 해당하는 값
categories2 = df2.columns[1:].tolist()
# # 컬러맵 설정
colormap = plt.cm.tab20
color_list = [colormap(i) for i in range(len(categories2))]
# # colors = ['red', 'blue', 'green']
fig, ax = plt.subplots(figsize=(16, 10))
# 각 지역에 대한 산점도 그리기
for idx, category in enumerate(categories2):
y_values = df2[category].tolist()
ax.scatter(areas, y_values, color=color_list[idx], label=category)
ax.set_ylabel('값')
ax.set_xlabel('지역명')
ax.set_title('지역별 카테고리 값(정규화 후)')
ax.legend()
plt.xticks(rotation=45)
plt.tight_layout()
plt.show()
if __name__ == '__main__':
Graph().MONTHLY_AVERAGE_ESTIMATED_SALES_ADMINISTRATIVE_DISTRICT()
6. 프로그램 시연
6.1. 프로그램 구동 사진


6.2. 프로그램 구동 영상

7. 첨부파일
https://github.com/guaba98/FranchiseProject
GitHub - guaba98/FranchiseProject: 프랜차이즈 상권 분석 프로그램
프랜차이즈 상권 분석 프로그램. Contribute to guaba98/FranchiseProject development by creating an account on GitHub.
github.com
'공부_백업용 > 프로젝트 모음' 카테고리의 다른 글
| [팀프로젝트] (23.8.22 ~ 9.2) 머신러닝 딥러닝 활용한 얼굴인식 출결 프로그램 (0) | 2023.09.03 |
|---|---|
| [팀프로젝트 주제발표] 머신러닝과 딥러닝을 활용한 출결관리 시스템 주제 발표 (0) | 2023.08.31 |
| [팀프로젝트] (23.7.24 ~ 7.29) 업무 협업툴 만들기 (0) | 2023.08.19 |
| [팀프로젝트] (23.7.10 ~ 7.16) 채팅 프로그램 만들기 개발완료보고서 (2) | 2023.08.19 |
| [팀프로젝트] (23.7.3 ~ 7.8) 서울 관광 프로그램 개발완성보고서 (2) | 2023.08.19 |